Joao Rulff
MOUNTAINEER: Topology-Driven Visual Analytics for Comparing Local Explanations
Jun 21, 2024Abstract:With the increasing use of black-box Machine Learning (ML) techniques in critical applications, there is a growing demand for methods that can provide transparency and accountability for model predictions. As a result, a large number of local explainability methods for black-box models have been developed and popularized. However, machine learning explanations are still hard to evaluate and compare due to the high dimensionality, heterogeneous representations, varying scales, and stochastic nature of some of these methods. Topological Data Analysis (TDA) can be an effective method in this domain since it can be used to transform attributions into uniform graph representations, providing a common ground for comparison across different explanation methods. We present a novel topology-driven visual analytics tool, Mountaineer, that allows ML practitioners to interactively analyze and compare these representations by linking the topological graphs back to the original data distribution, model predictions, and feature attributions. Mountaineer facilitates rapid and iterative exploration of ML explanations, enabling experts to gain deeper insights into the explanation techniques, understand the underlying data distributions, and thus reach well-founded conclusions about model behavior. Furthermore, we demonstrate the utility of Mountaineer through two case studies using real-world data. In the first, we show how Mountaineer enabled us to compare black-box ML explanations and discern regions of and causes of disagreements between different explanations. In the second, we demonstrate how the tool can be used to compare and understand ML models themselves. Finally, we conducted interviews with three industry experts to help us evaluate our work.
ARTiST: Automated Text Simplification for Task Guidance in Augmented Reality
Feb 29, 2024


Abstract:Text presented in augmented reality provides in-situ, real-time information for users. However, this content can be challenging to apprehend quickly when engaging in cognitively demanding AR tasks, especially when it is presented on a head-mounted display. We propose ARTiST, an automatic text simplification system that uses a few-shot prompt and GPT-3 models to specifically optimize the text length and semantic content for augmented reality. Developed out of a formative study that included seven users and three experts, our system combines a customized error calibration model with a few-shot prompt to integrate the syntactic, lexical, elaborative, and content simplification techniques, and generate simplified AR text for head-worn displays. Results from a 16-user empirical study showed that ARTiST lightens the cognitive load and improves performance significantly over both unmodified text and text modified via traditional methods. Our work constitutes a step towards automating the optimization of batch text data for readability and performance in augmented reality.
Granularity at Scale: Estimating Neighborhood Well-Being from High-Resolution Orthographic Imagery and Hybrid Learning
Sep 28, 2023


Abstract:Many areas of the world are without basic information on the well-being of the residing population due to limitations in existing data collection methods. Overhead images obtained remotely, such as from satellite or aircraft, can help serve as windows into the state of life on the ground and help "fill in the gaps" where community information is sparse, with estimates at smaller geographic scales requiring higher resolution sensors. Concurrent with improved sensor resolutions, recent advancements in machine learning and computer vision have made it possible to quickly extract features from and detect patterns in image data, in the process correlating these features with other information. In this work, we explore how well two approaches, a supervised convolutional neural network and semi-supervised clustering based on bag-of-visual-words, estimate population density, median household income, and educational attainment of individual neighborhoods from publicly available high-resolution imagery of cities throughout the United States. Results and analyses indicate that features extracted from the imagery can accurately estimate the density (R$^2$ up to 0.81) of neighborhoods, with the supervised approach able to explain about half the variation in a population's income and education. In addition to the presented approaches serving as a basis for further geographic generalization, the novel semi-supervised approach provides a foundation for future work seeking to estimate fine-scale information from overhead imagery without the need for label data.
Calibrate: Interactive Analysis of Probabilistic Model Output
Jul 27, 2022
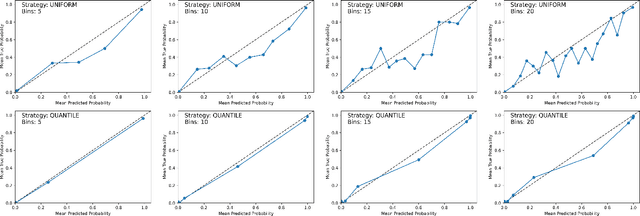
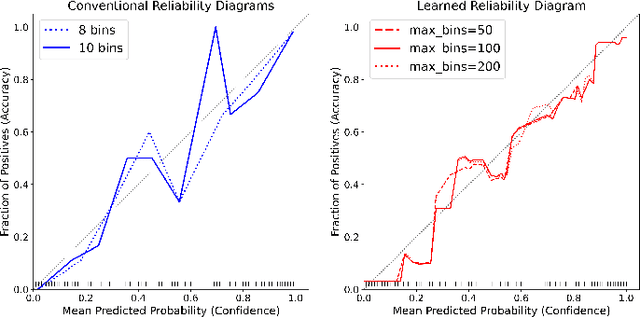
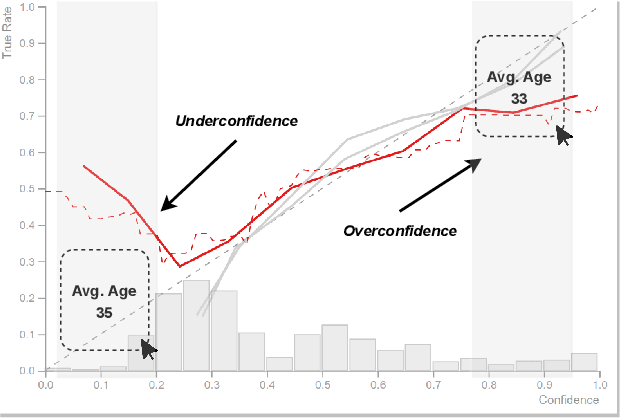
Abstract:Analyzing classification model performance is a crucial task for machine learning practitioners. While practitioners often use count-based metrics derived from confusion matrices, like accuracy, many applications, such as weather prediction, sports betting, or patient risk prediction, rely on a classifier's predicted probabilities rather than predicted labels. In these instances, practitioners are concerned with producing a calibrated model, that is, one which outputs probabilities that reflect those of the true distribution. Model calibration is often analyzed visually, through static reliability diagrams, however, the traditional calibration visualization may suffer from a variety of drawbacks due to the strong aggregations it necessitates. Furthermore, count-based approaches are unable to sufficiently analyze model calibration. We present Calibrate, an interactive reliability diagram that addresses the aforementioned issues. Calibrate constructs a reliability diagram that is resistant to drawbacks in traditional approaches, and allows for interactive subgroup analysis and instance-level inspection. We demonstrate the utility of Calibrate through use cases on both real-world and synthetic data. We further validate Calibrate by presenting the results of a think-aloud experiment with data scientists who routinely analyze model calibration.
Urban Rhapsody: Large-scale exploration of urban soundscapes
May 25, 2022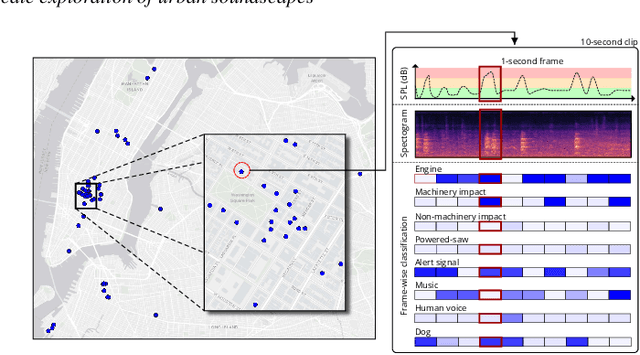
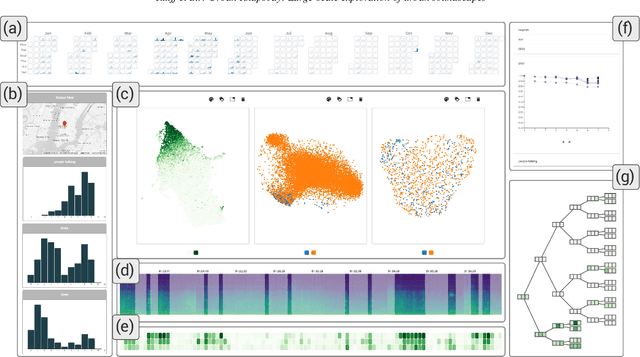


Abstract:Noise is one of the primary quality-of-life issues in urban environments. In addition to annoyance, noise negatively impacts public health and educational performance. While low-cost sensors can be deployed to monitor ambient noise levels at high temporal resolutions, the amount of data they produce and the complexity of these data pose significant analytical challenges. One way to address these challenges is through machine listening techniques, which are used to extract features in attempts to classify the source of noise and understand temporal patterns of a city's noise situation. However, the overwhelming number of noise sources in the urban environment and the scarcity of labeled data makes it nearly impossible to create classification models with large enough vocabularies that capture the true dynamism of urban soundscapes In this paper, we first identify a set of requirements in the yet unexplored domain of urban soundscape exploration. To satisfy the requirements and tackle the identified challenges, we propose Urban Rhapsody, a framework that combines state-of-the-art audio representation, machine learning, and visual analytics to allow users to interactively create classification models, understand noise patterns of a city, and quickly retrieve and label audio excerpts in order to create a large high-precision annotated database of urban sound recordings. We demonstrate the tool's utility through case studies performed by domain experts using data generated over the five-year deployment of a one-of-a-kind sensor network in New York City.
A Study on Robustness to Perturbations for Representations of Environmental Sound
Mar 23, 2022
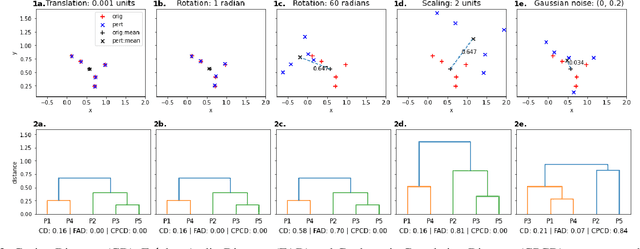
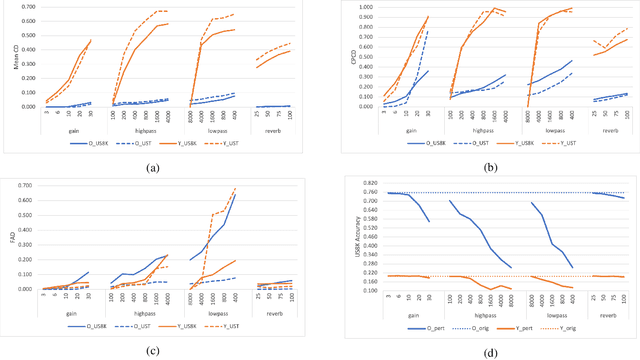
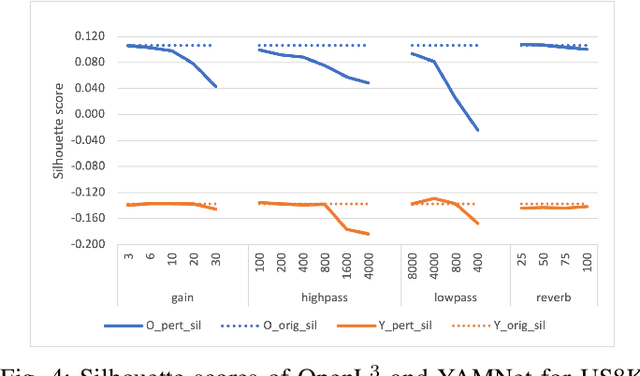
Abstract:Audio applications involving environmental sound analysis increasingly use general-purpose audio representations, also known as embeddings, for transfer learning. Recently, Holistic Evaluation of Audio Representations (HEAR) evaluated twenty-nine embedding models on nineteen diverse tasks. However, the evaluation's effectiveness depends on the variation already captured within a given dataset. Therefore, for a given data domain, it is unclear how the representations would be affected by the variations caused by myriad microphones' range and acoustic conditions -- commonly known as channel effects. We aim to extend HEAR to evaluate invariance to channel effects in this work. To accomplish this, we imitate channel effects by injecting perturbations to the audio signal and measure the shift in the new (perturbed) embeddings with three distance measures, making the evaluation domain-dependent but not task-dependent. Combined with the downstream performance, it helps us make a more informed prediction of how robust the embeddings are to the channel effects. We evaluate two embeddings -- YAMNet, and OpenL$^3$ on monophonic (UrbanSound8K) and polyphonic (SONYC UST) datasets. We show that one distance measure does not suffice in such task-independent evaluation. Although Fr\'echet Audio Distance (FAD) correlates with the trend of the performance drop in the downstream task most accurately, we show that we need to study this in conjunction with the other distances to get a clear understanding of the overall effect of the perturbation. In terms of the embedding performance, we find OpenL$^3$ to be more robust to YAMNet, which aligns with the HEAR evaluation.
 Add to Chrome
 Add to Firefox
 Add to Edge