Haekyu Park
Polo
Interactive Visual Learning for Stable Diffusion
Apr 22, 2024Abstract:Diffusion-based generative models' impressive ability to create convincing images has garnered global attention. However, their complex internal structures and operations often pose challenges for non-experts to grasp. We introduce Diffusion Explainer, the first interactive visualization tool designed to elucidate how Stable Diffusion transforms text prompts into images. It tightly integrates a visual overview of Stable Diffusion's complex components with detailed explanations of their underlying operations. This integration enables users to fluidly transition between multiple levels of abstraction through animations and interactive elements. Offering real-time hands-on experience, Diffusion Explainer allows users to adjust Stable Diffusion's hyperparameters and prompts without the need for installation or specialized hardware. Accessible via users' web browsers, Diffusion Explainer is making significant strides in democratizing AI education, fostering broader public access. More than 7,200 users spanning 113 countries have used our open-sourced tool at https://poloclub.github.io/diffusion-explainer/. A video demo is available at https://youtu.be/MbkIADZjPnA.
Diffusion Explainer: Visual Explanation for Text-to-image Stable Diffusion
May 08, 2023


Abstract:Diffusion-based generative models' impressive ability to create convincing images has captured global attention. However, their complex internal structures and operations often make them difficult for non-experts to understand. We present Diffusion Explainer, the first interactive visualization tool that explains how Stable Diffusion transforms text prompts into images. Diffusion Explainer tightly integrates a visual overview of Stable Diffusion's complex components with detailed explanations of their underlying operations, enabling users to fluidly transition between multiple levels of abstraction through animations and interactive elements. By comparing the evolutions of image representations guided by two related text prompts over refinement timesteps, users can discover the impact of prompts on image generation. Diffusion Explainer runs locally in users' web browsers without the need for installation or specialized hardware, broadening the public's education access to modern AI techniques. Our open-sourced tool is available at: https://poloclub.github.io/diffusion-explainer/. A video demo is available at https://youtu.be/Zg4gxdIWDds.
NeuroMapper: In-browser Visualizer for Neural Network Training
Oct 22, 2022
Abstract:We present our ongoing work NeuroMapper, an in-browser visualization tool that helps machine learning (ML) developers interpret the evolution of a model during training, providing a new way to monitor the training process and visually discover reasons for suboptimal training. While most existing deep neural networks (DNNs) interpretation tools are designed for already-trained model, NeuroMapper scalably visualizes the evolution of the embeddings of a model's blocks across training epochs, enabling real-time visualization of 40,000 embedded points. To promote the embedding visualizations' spatial coherence across epochs, NeuroMapper adapts AlignedUMAP, a recent nonlinear dimensionality reduction technique to align the embeddings. With NeuroMapper, users can explore the training dynamics of a Resnet-50 model, and adjust the embedding visualizations' parameters in real time. NeuroMapper is open-sourced at https://github.com/poloclub/NeuroMapper and runs in all modern web browsers. A demo of the tool in action is available at: https://poloclub.github.io/NeuroMapper/.
ConceptEvo: Interpreting Concept Evolution in Deep Learning Training
Mar 30, 2022


Abstract:Deep neural networks (DNNs) have been widely used for decision making, prompting a surge of interest in interpreting how these complex models work. Recent literature on DNN interpretation has revolved around already-trained models; however, much less research focuses on interpreting how the models evolve as they are trained. Interpreting model evolution is crucial to monitor network training and can aid proactive decisions about necessary interventions. In this work, we present ConceptEvo, a general interpretation framework for DNNs that reveals the inception and evolution of detected concepts during training. Through a large-scale human evaluation with 260 participants and quantitative experiments, we show that ConceptEvo discovers evolution across different models that are meaningful to humans, helpful for early-training intervention decisions, and crucial to the prediction for a given class.
NeuroCartography: Scalable Automatic Visual Summarization of Concepts in Deep Neural Networks
Aug 29, 2021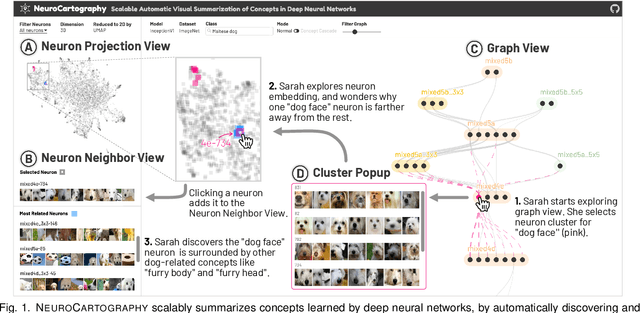
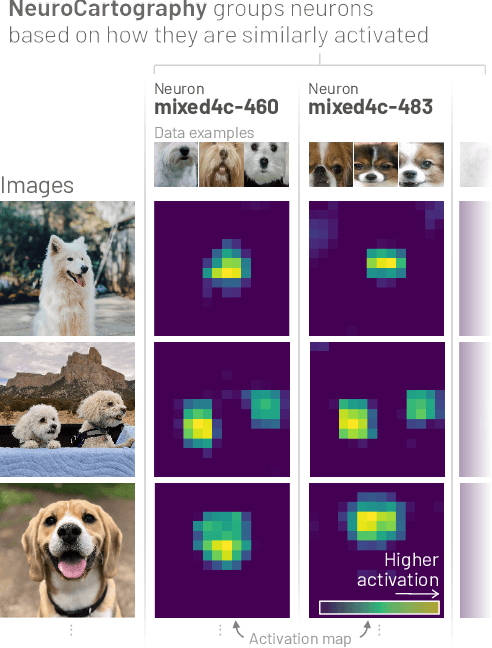
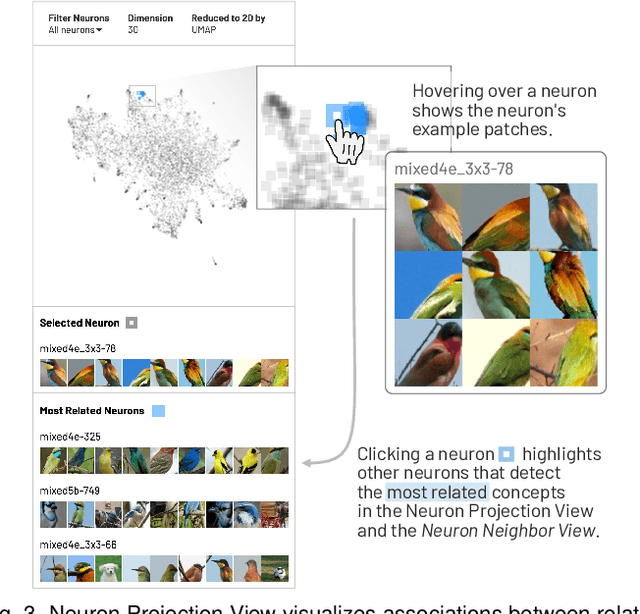
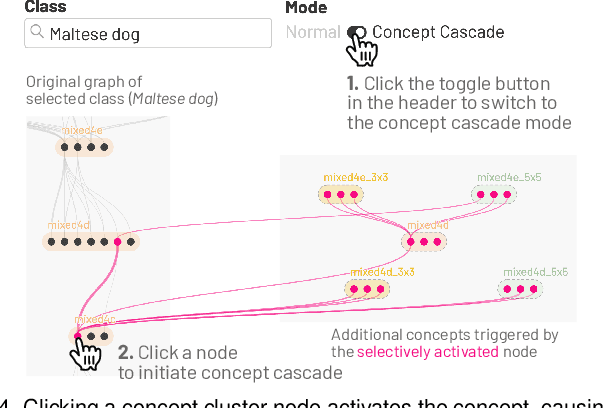
Abstract:Existing research on making sense of deep neural networks often focuses on neuron-level interpretation, which may not adequately capture the bigger picture of how concepts are collectively encoded by multiple neurons. We present NeuroCartography, an interactive system that scalably summarizes and visualizes concepts learned by neural networks. It automatically discovers and groups neurons that detect the same concepts, and describes how such neuron groups interact to form higher-level concepts and the subsequent predictions. NeuroCartography introduces two scalable summarization techniques: (1) neuron clustering groups neurons based on the semantic similarity of the concepts detected by neurons (e.g., neurons detecting "dog faces" of different breeds are grouped); and (2) neuron embedding encodes the associations between related concepts based on how often they co-occur (e.g., neurons detecting "dog face" and "dog tail" are placed closer in the embedding space). Key to our scalable techniques is the ability to efficiently compute all neuron pairs' relationships, in time linear to the number of neurons instead of quadratic time. NeuroCartography scales to large data, such as the ImageNet dataset with 1.2M images. The system's tightly coordinated views integrate the scalable techniques to visualize the concepts and their relationships, projecting the concept associations to a 2D space in Neuron Projection View, and summarizing neuron clusters and their relationships in Graph View. Through a large-scale human evaluation, we demonstrate that our technique discovers neuron groups that represent coherent, human-meaningful concepts. And through usage scenarios, we describe how our approaches enable interesting and surprising discoveries, such as concept cascades of related and isolated concepts. The NeuroCartography visualization runs in modern browsers and is open-sourced.
Quantifying the Impact of Human Capital, Job History, and Language Factors on Job Seniority with a Large-scale Analysis of Resumes
Jun 15, 2021


Abstract:As job markets worldwide have become more competitive and applicant selection criteria have become more opaque, and different (and sometimes contradictory) information and advice is available for job seekers wishing to progress in their careers, it has never been more difficult to determine which factors in a r\'esum\'e most effectively help career progression. In this work we present a novel, large scale dataset of over half a million r\'esum\'es with preliminary analysis to begin to answer empirically which factors help or hurt people wishing to transition to more senior roles as they progress in their career. We find that previous experience forms the most important factor, outweighing other aspects of human capital, and find which language factors in a r\'esum\'e have significant effects. This lays the groundwork for future inquiry in career trajectories using large scale data analysis and natural language processing techniques.
RECAST: Enabling User Recourse and Interpretability of Toxicity Detection Models with Interactive Visualization
Feb 10, 2021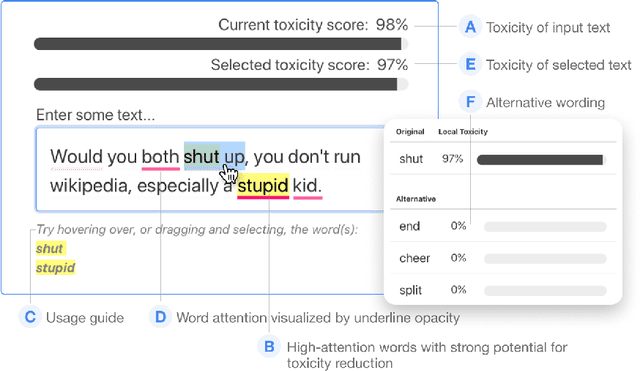


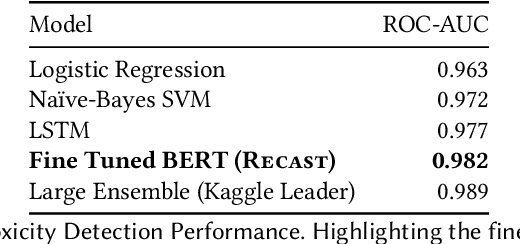
Abstract:With the widespread use of toxic language online, platforms are increasingly using automated systems that leverage advances in natural language processing to automatically flag and remove toxic comments. However, most automated systems -- when detecting and moderating toxic language -- do not provide feedback to their users, let alone provide an avenue of recourse for these users to make actionable changes. We present our work, RECAST, an interactive, open-sourced web tool for visualizing these models' toxic predictions, while providing alternative suggestions for flagged toxic language. Our work also provides users with a new path of recourse when using these automated moderation tools. RECAST highlights text responsible for classifying toxicity, and allows users to interactively substitute potentially toxic phrases with neutral alternatives. We examined the effect of RECAST via two large-scale user evaluations, and found that RECAST was highly effective at helping users reduce toxicity as detected through the model. Users also gained a stronger understanding of the underlying toxicity criterion used by black-box models, enabling transparency and recourse. In addition, we found that when users focus on optimizing language for these models instead of their own judgement (which is the implied incentive and goal of deploying automated models), these models cease to be effective classifiers of toxicity compared to human annotations. This opens a discussion for how toxicity detection models work and should work, and their effect on the future of online discourse.
SkeletonVis: Interactive Visualization for Understanding Adversarial Attacks on Human Action Recognition Models
Jan 26, 2021
Abstract:Skeleton-based human action recognition technologies are increasingly used in video based applications, such as home robotics, healthcare on aging population, and surveillance. However, such models are vulnerable to adversarial attacks, raising serious concerns for their use in safety-critical applications. To develop an effective defense against attacks, it is essential to understand how such attacks mislead the pose detection models into making incorrect predictions. We present SkeletonVis, the first interactive system that visualizes how the attacks work on the models to enhance human understanding of attacks.
Bluff: Interactively Deciphering Adversarial Attacks on Deep Neural Networks
Sep 08, 2020
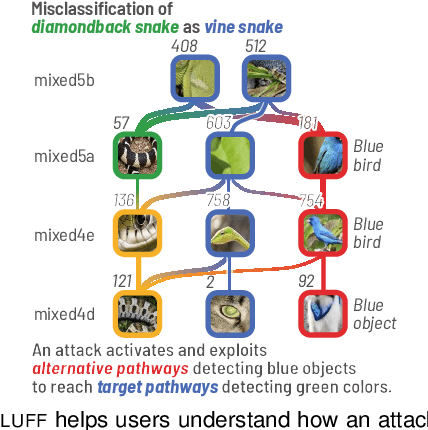
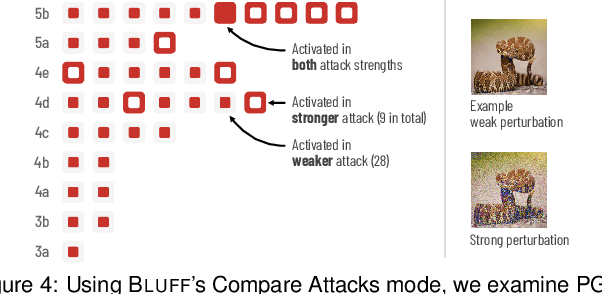
Abstract:Deep neural networks (DNNs) are now commonly used in many domains. However, they are vulnerable to adversarial attacks: carefully crafted perturbations on data inputs that can fool a model into making incorrect predictions. Despite significant research on developing DNN attack and defense techniques, people still lack an understanding of how such attacks penetrate a model's internals. We present Bluff, an interactive system for visualizing, characterizing, and deciphering adversarial attacks on vision-based neural networks. Bluff allows people to flexibly visualize and compare the activation pathways for benign and attacked images, revealing mechanisms that adversarial attacks employ to inflict harm on a model. Bluff is open-sourced and runs in modern web browsers.
CNN Explainer: Learning Convolutional Neural Networks with Interactive Visualization
May 01, 2020


Abstract:Deep learning's great success motivates many practitioners and students to learn about this exciting technology. However, it is often challenging for beginners to take their first step due to the complexity of understanding and applying deep learning. We present CNN Explainer, an interactive visualization tool designed for non-experts to learn and examine convolutional neural networks (CNNs), a foundational deep learning model architecture. Our tool addresses key challenges that novices face while learning about CNNs, which we identify from interviews with instructors and a survey with past students. Users can interactively visualize and inspect the data transformation and flow of intermediate results in a CNN. CNN Explainer tightly integrates a model overview that summarizes a CNN's structure, and on-demand, dynamic visual explanation views that help users understand the underlying components of CNNs. Through smooth transitions across levels of abstraction, our tool enables users to inspect the interplay between low-level operations (e.g., mathematical computations) and high-level outcomes (e.g., class predictions). To better understand our tool's benefits, we conducted a qualitative user study, which shows that CNN Explainer can help users more easily understand the inner workings of CNNs, and is engaging and enjoyable to use. We also derive design lessons from our study. Developed using modern web technologies, CNN Explainer runs locally in users' web browsers without the need for installation or specialized hardware, broadening the public's education access to modern deep learning techniques.
 Add to Chrome
 Add to Firefox
 Add to Edge