Madelon Hulsebos
Are We Asking the Right Questions? On Ambiguity in Natural Language Queries for Tabular Data Analysis
Nov 06, 2025Abstract:Natural language interfaces to tabular data must handle ambiguities inherent to queries. Instead of treating ambiguity as a deficiency, we reframe it as a feature of cooperative interaction, where the responsibility of query specification is shared among the user and the system. We develop a principled framework distinguishing cooperative queries, i.e., queries that yield a resolvable interpretation, from uncooperative queries that cannot be resolved. Applying the framework to evaluations for tabular question answering and analysis, we analyze the queries in 15 popular datasets, and observe an uncontrolled mixing of query types neither adequate for evaluating a system's execution accuracy nor for evaluating interpretation capabilities. Our framework and analysis of queries shifts the perspective from fixing ambiguity to embracing cooperation in resolving queries. This reflection enables more informed design and evaluation for natural language interfaces for tabular data, for which we outline implications and directions for future research.
TARGET: Benchmarking Table Retrieval for Generative Tasks
May 14, 2025Abstract:The data landscape is rich with structured data, often of high value to organizations, driving important applications in data analysis and machine learning. Recent progress in representation learning and generative models for such data has led to the development of natural language interfaces to structured data, including those leveraging text-to-SQL. Contextualizing interactions, either through conversational interfaces or agentic components, in structured data through retrieval-augmented generation can provide substantial benefits in the form of freshness, accuracy, and comprehensiveness of answers. The key question is: how do we retrieve the right table(s) for the analytical query or task at hand? To this end, we introduce TARGET: a benchmark for evaluating TAble Retrieval for GEnerative Tasks. With TARGET we analyze the retrieval performance of different retrievers in isolation, as well as their impact on downstream tasks. We find that dense embedding-based retrievers far outperform a BM25 baseline which is less effective than it is for retrieval over unstructured text. We also surface the sensitivity of retrievers across various metadata (e.g., missing table titles), and demonstrate a stark variation of retrieval performance across datasets and tasks. TARGET is available at https://target-benchmark.github.io.
How well do LLMs reason over tabular data, really?
May 12, 2025Abstract:Large Language Models (LLMs) excel in natural language tasks, but less is known about their reasoning capabilities over tabular data. Prior analyses devise evaluation strategies that poorly reflect an LLM's realistic performance on tabular queries. Moreover, we have a limited understanding of the robustness of LLMs towards realistic variations in tabular inputs. Therefore, we ask: Can general-purpose LLMs reason over tabular data, really?, and focus on two questions 1) are tabular reasoning capabilities of general-purpose LLMs robust to real-world characteristics of tabular inputs, and 2) how can we realistically evaluate an LLM's performance on analytical tabular queries? Building on a recent tabular reasoning benchmark, we first surface shortcomings of its multiple-choice prompt evaluation strategy, as well as commonly used free-form text metrics such as SacreBleu and BERT-score. We show that an LLM-as-a-judge procedure yields more reliable performance insights and unveil a significant deficit in tabular reasoning performance of LLMs. We then extend the tabular inputs reflecting three common characteristics in practice: 1) missing values, 2) duplicate entities, and 3) structural variations. Experiments show that the tabular reasoning capabilities of general-purpose LLMs suffer from these variations, stressing the importance of improving their robustness for realistic tabular inputs.
AdaTyper: Adaptive Semantic Column Type Detection
Nov 23, 2023


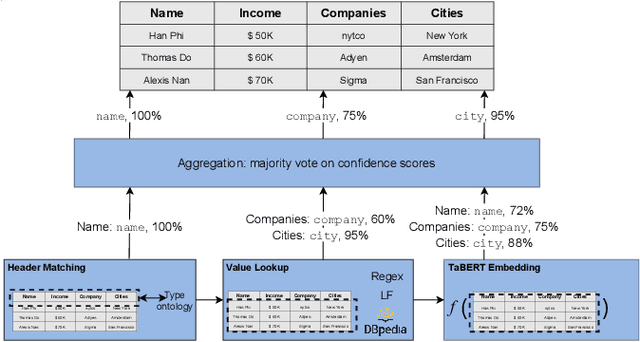
Abstract:Understanding the semantics of relational tables is instrumental for automation in data exploration and preparation systems. A key source for understanding a table is the semantics of its columns. With the rise of deep learning, learned table representations are now available, which can be applied for semantic type detection and achieve good performance on benchmarks. Nevertheless, we observe a gap between this performance and its applicability in practice. In this paper, we propose AdaTyper to address one of the most critical deployment challenges: adaptation. AdaTyper uses weak-supervision to adapt a hybrid type predictor towards new semantic types and shifted data distributions at inference time, using minimal human feedback. The hybrid type predictor of AdaTyper combines rule-based methods and a light machine learning model for semantic column type detection. We evaluate the adaptation performance of AdaTyper on real-world database tables hand-annotated with semantic column types through crowdsourcing and find that the f1-score improves for new and existing types. AdaTyper approaches an average precision of 0.6 after only seeing 5 examples, significantly outperforming existing adaptation methods based on human-provided regular expressions or dictionaries.
Observatory: Characterizing Embeddings of Relational Tables
Oct 05, 2023


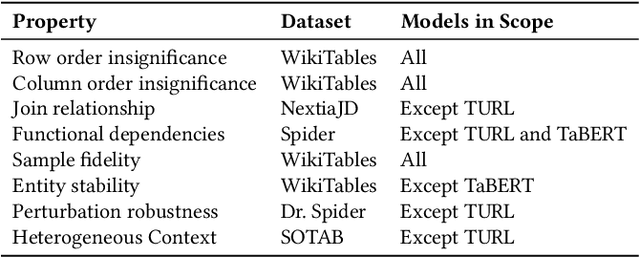
Abstract:Language models and specialized table embedding models have recently demonstrated strong performance on many tasks over tabular data. Researchers and practitioners are keen to leverage these models in many new application contexts; but limited understanding of the strengths and weaknesses of these models, and the table representations they generate, makes the process of finding a suitable model for a given task reliant on trial and error. There is an urgent need to gain a comprehensive understanding of these models to minimize inefficiency and failures in downstream usage. To address this need, we propose Observatory, a formal framework to systematically analyze embedding representations of relational tables. Motivated both by invariants of the relational data model and by statistical considerations regarding data distributions, we define eight primitive properties, and corresponding measures to quantitatively characterize table embeddings for these properties. Based on these properties, we define an extensible framework to evaluate language and table embedding models. We collect and synthesize a suite of datasets and use Observatory to analyze seven such models. Our analysis provides insights into the strengths and weaknesses of learned representations over tables. We find, for example, that some models are sensitive to table structure such as column order, that functional dependencies are rarely reflected in embeddings, and that specialized table embedding models have relatively lower sample fidelity. Such insights help researchers and practitioners better anticipate model behaviors and select appropriate models for their downstream tasks, while guiding researchers in the development of new models.
Augmenting Decision Making via Interactive What-If Analysis
Sep 21, 2021

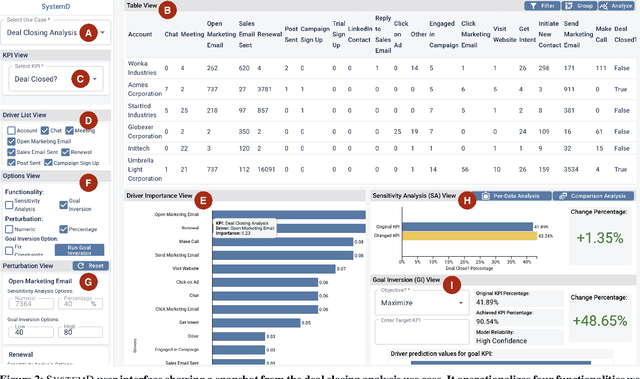
Abstract:The fundamental goal of business data analysis is to improve business decisions using data. Business users such as sales, marketing, product, or operations managers often make decisions to achieve key performance indicator (KPI) goals such as increasing customer retention, decreasing cost, and increasing sales. To discover the relationship between data attributes hypothesized to be drivers and those corresponding to KPIs of interest, business users currently need to perform lengthy exploratory analyses, considering multitudes of combinations and scenarios, slicing, dicing, and transforming the data accordingly. For example, analyzing customer retention across quarters of the year or suggesting optimal media channels across strata of customers. However, the increasing complexity of datasets combined with the cognitive limitations of humans makes it challenging to carry over multiple hypotheses, even for simple datasets. Therefore mentally performing such analyses is hard. Existing commercial tools either provide partial solutions whose effectiveness remains unclear or fail to cater to business users. Here we argue for four functionalities that we believe are necessary to enable business users to interactively learn and reason about the relationships (functions) between sets of data attributes, facilitating data-driven decision making. We implement these functionalities in SystemD, an interactive visual analysis system enabling business users to experiment with the data by asking what-if questions. We evaluate the system through three business use cases: marketing mix modeling analysis, customer retention analysis, and deal closing analysis, and report on feedback from multiple business users. Overall, business users find SystemD intuitive and useful for quick testing and validation of their hypotheses around interested KPI as well as in making effective and fast data-driven decisions.
Making Table Understanding Work in Practice
Sep 11, 2021


Abstract:Understanding the semantics of tables at scale is crucial for tasks like data integration, preparation, and search. Table understanding methods aim at detecting a table's topic, semantic column types, column relations, or entities. With the rise of deep learning, powerful models have been developed for these tasks with excellent accuracy on benchmarks. However, we observe that there exists a gap between the performance of these models on these benchmarks and their applicability in practice. In this paper, we address the question: what do we need for these models to work in practice? We discuss three challenges of deploying table understanding models and propose a framework to address them. These challenges include 1) difficulty in customizing models to specific domains, 2) lack of training data for typical database tables often found in enterprises, and 3) lack of confidence in the inferences made by models. We present SigmaTyper which implements this framework for the semantic column type detection task. SigmaTyper encapsulates a hybrid model trained on GitTables and integrates a lightweight human-in-the-loop approach to customize the model. Lastly, we highlight avenues for future research that further close the gap towards making table understanding effective in practice.
GitTables: A Large-Scale Corpus of Relational Tables
Jun 14, 2021


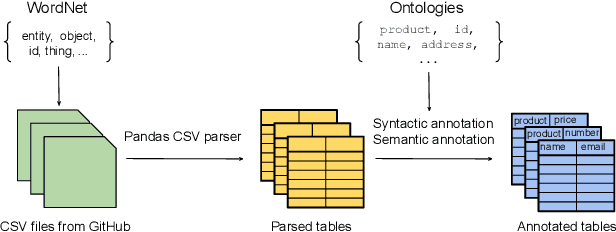
Abstract:The practical success of deep learning has sparked interest in improving relational table tasks, like data search, with models trained on large table corpora. Existing corpora primarily contain tables extracted from HTML pages, limiting the capability to represent offline database tables. To train and evaluate high-capacity models for applications beyond the Web, we need additional resources with tables that resemble relational database tables. Here we introduce GitTables, a corpus of currently 1.7M relational tables extracted from GitHub. Our continuing curation aims at growing the corpus to at least 20M tables. We annotate table columns in GitTables with more than 2K different semantic types from Schema.org and DBpedia. Our column annotations consist of semantic types, hierarchical relations, range types and descriptions. The corpus is available at https://gittables.github.io. Our analysis of GitTables shows that its structure, content, and topical coverage differ significantly from existing table corpora. We evaluate our annotation pipeline on hand-labeled tables from the T2Dv2 benchmark and find that our approach provides results on par with human annotations. We demonstrate a use case of GitTables by training a semantic type detection model on it and obtain high prediction accuracy. We also show that the same model trained on tables from theWeb generalizes poorly.
Sato: Contextual Semantic Type Detection in Tables
Nov 14, 2019


Abstract:Detecting the semantic types of data columns in relational tables is important for various data preparation and information retrieval tasks such as data cleaning, schema matching, data discovery, and semantic search. However, existing detection approaches either perform poorly with dirty data, support only a limited number of semantic types, fail to incorporate the table context of columns or rely on large sample sizes in the training data. We introduce Sato, a hybrid machine learning model to automatically detect the semantic types of columns in tables, exploiting the signals from the context as well as the column values. Sato combines a deep learning model trained on a large-scale table corpus with topic modeling and structured prediction to achieve support-weighted and macro average F1 scores of 0.901 and 0.973, respectively, exceeding the state-of-the-art performance by a significant margin. We extensively analyze the overall and per-type performance of Sato, discussing how individual modeling components, as well as feature categories, contribute to its performance.
Sherlock: A Deep Learning Approach to Semantic Data Type Detection
May 25, 2019


Abstract:Correctly detecting the semantic type of data columns is crucial for data science tasks such as automated data cleaning, schema matching, and data discovery. Existing data preparation and analysis systems rely on dictionary lookups and regular expression matching to detect semantic types. However, these matching-based approaches often are not robust to dirty data and only detect a limited number of types. We introduce Sherlock, a multi-input deep neural network for detecting semantic types. We train Sherlock on $686,765$ data columns retrieved from the VizNet corpus by matching $78$ semantic types from DBpedia to column headers. We characterize each matched column with $1,588$ features describing the statistical properties, character distributions, word embeddings, and paragraph vectors of column values. Sherlock achieves a support-weighted F$_1$ score of $0.89$, exceeding that of machine learning baselines, dictionary and regular expression benchmarks, and the consensus of crowdsourced annotations.
 Add to Chrome
 Add to Firefox
 Add to Edge