Arvind Satyanarayan
Toward Cultural Interpretability: A Linguistic Anthropological Framework for Describing and Evaluating Large Language Models (LLMs)
Nov 07, 2024Abstract:This article proposes a new integration of linguistic anthropology and machine learning (ML) around convergent interests in both the underpinnings of language and making language technologies more socially responsible. While linguistic anthropology focuses on interpreting the cultural basis for human language use, the ML field of interpretability is concerned with uncovering the patterns that Large Language Models (LLMs) learn from human verbal behavior. Through the analysis of a conversation between a human user and an LLM-powered chatbot, we demonstrate the theoretical feasibility of a new, conjoint field of inquiry, cultural interpretability (CI). By focusing attention on the communicative competence involved in the way human users and AI chatbots co-produce meaning in the articulatory interface of human-computer interaction, CI emphasizes how the dynamic relationship between language and culture makes contextually sensitive, open-ended conversation possible. We suggest that, by examining how LLMs internally "represent" relationships between language and culture, CI can: (1) provide insight into long-standing linguistic anthropological questions about the patterning of those relationships; and (2) aid model developers and interface designers in improving value alignment between language models and stylistically diverse speakers and culturally diverse speech communities. Our discussion proposes three critical research axes: relativity, variation, and indexicality.
Abstraction Alignment: Comparing Model and Human Conceptual Relationships
Jul 17, 2024


Abstract:Abstraction -- the process of generalizing specific examples into broad reusable patterns -- is central to how people efficiently process and store information and apply their knowledge to new data. Promisingly, research has shown that ML models learn representations that span levels of abstraction, from specific concepts like "bolo tie" and "car tire" to more general concepts like "CEO" and "model". However, existing techniques analyze these representations in isolation, treating learned concepts as independent artifacts rather than an interconnected web of abstraction. As a result, although we can identify the concepts a model uses to produce its output, it is difficult to assess if it has learned a human-aligned abstraction of the concepts that will generalize to new data. To address this gap, we introduce abstraction alignment, a methodology to measure the agreement between a model's learned abstraction and the expected human abstraction. We quantify abstraction alignment by comparing model outputs against a human abstraction graph, such as linguistic relationships or medical disease hierarchies. In evaluation tasks interpreting image models, benchmarking language models, and analyzing medical datasets, abstraction alignment provides a deeper understanding of model behavior and dataset content, differentiating errors based on their agreement with human knowledge, expanding the verbosity of current model quality metrics, and revealing ways to improve existing human abstractions.
What is a Fair Diffusion Model? Designing Generative Text-To-Image Models to Incorporate Various Worldviews
Sep 18, 2023Abstract:Generative text-to-image (GTI) models produce high-quality images from short textual descriptions and are widely used in academic and creative domains. However, GTI models frequently amplify biases from their training data, often producing prejudiced or stereotypical images. Yet, current bias mitigation strategies are limited and primarily focus on enforcing gender parity across occupations. To enhance GTI bias mitigation, we introduce DiffusionWorldViewer, a tool to analyze and manipulate GTI models' attitudes, values, stories, and expectations of the world that impact its generated images. Through an interactive interface deployed as a web-based GUI and Jupyter Notebook plugin, DiffusionWorldViewer categorizes existing demographics of GTI-generated images and provides interactive methods to align image demographics with user worldviews. In a study with 13 GTI users, we find that DiffusionWorldViewer allows users to represent their varied viewpoints about what GTI outputs are fair and, in doing so, challenges current notions of fairness that assume a universal worldview.
VisText: A Benchmark for Semantically Rich Chart Captioning
Jun 28, 2023


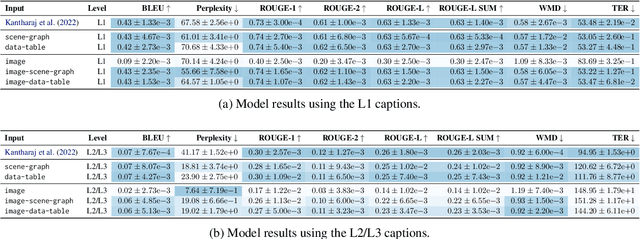
Abstract:Captions that describe or explain charts help improve recall and comprehension of the depicted data and provide a more accessible medium for people with visual disabilities. However, current approaches for automatically generating such captions struggle to articulate the perceptual or cognitive features that are the hallmark of charts (e.g., complex trends and patterns). In response, we introduce VisText: a dataset of 12,441 pairs of charts and captions that describe the charts' construction, report key statistics, and identify perceptual and cognitive phenomena. In VisText, a chart is available as three representations: a rasterized image, a backing data table, and a scene graph -- a hierarchical representation of a chart's visual elements akin to a web page's Document Object Model (DOM). To evaluate the impact of VisText, we fine-tune state-of-the-art language models on our chart captioning task and apply prefix-tuning to produce captions that vary the semantic content they convey. Our models generate coherent, semantically rich captions and perform on par with state-of-the-art chart captioning models across machine translation and text generation metrics. Through qualitative analysis, we identify six broad categories of errors that our models make that can inform future work.
Beyond Faithfulness: A Framework to Characterize and Compare Saliency Methods
Jun 07, 2022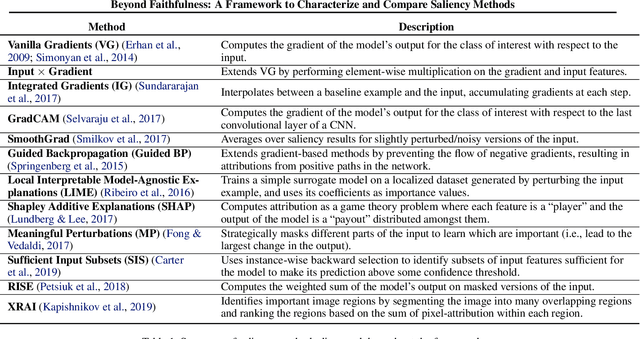
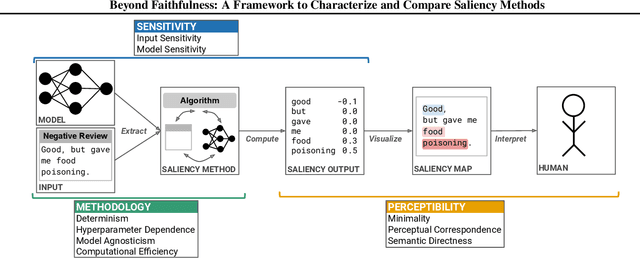
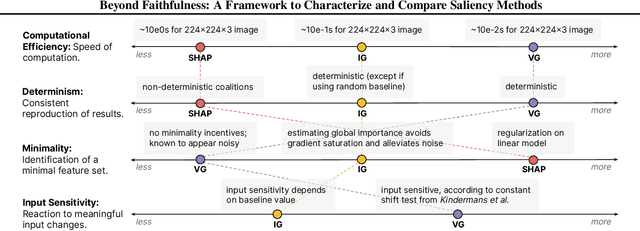
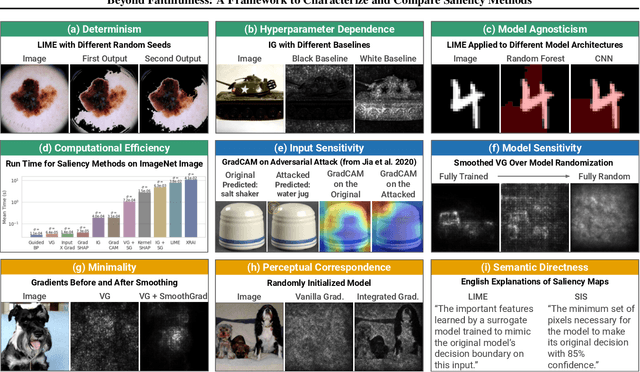
Abstract:Saliency methods calculate how important each input feature is to a machine learning model's prediction, and are commonly used to understand model reasoning. "Faithfulness", or how fully and accurately the saliency output reflects the underlying model, is an oft-cited desideratum for these methods. However, explanation methods must necessarily sacrifice certain information in service of user-oriented goals such as simplicity. To that end, and akin to performance metrics, we frame saliency methods as abstractions: individual tools that provide insight into specific aspects of model behavior and entail tradeoffs. Using this framing, we describe a framework of nine dimensions to characterize and compare the properties of saliency methods. We group these dimensions into three categories that map to different phases of the interpretation process: methodology, or how the saliency is calculated; sensitivity, or relationships between the saliency result and the underlying model or input; and, perceptibility, or how a user interprets the result. As we show, these dimensions give us a granular vocabulary for describing and comparing saliency methods -- for instance, allowing us to develop "saliency cards" as a form of documentation, or helping downstream users understand tradeoffs and choose a method for a particular use case. Moreover, by situating existing saliency methods within this framework, we identify opportunities for future work, including filling gaps in the landscape and developing new evaluation metrics.
Teaching Humans When To Defer to a Classifier via Examplars
Nov 22, 2021


Abstract:Expert decision makers are starting to rely on data-driven automated agents to assist them with various tasks. For this collaboration to perform properly, the human decision maker must have a mental model of when and when not to rely on the agent. In this work, we aim to ensure that human decision makers learn a valid mental model of the agent's strengths and weaknesses. To accomplish this goal, we propose an exemplar-based teaching strategy where humans solve the task with the help of the agent and try to formulate a set of guidelines of when and when not to defer. We present a novel parameterization of the human's mental model of the AI that applies a nearest neighbor rule in local regions surrounding the teaching examples. Using this model, we derive a near-optimal strategy for selecting a representative teaching set. We validate the benefits of our teaching strategy on a multi-hop question answering task using crowd workers and find that when workers draw the right lessons from the teaching stage, their task performance improves, we furthermore validate our method on a set of synthetic experiments.
LMdiff: A Visual Diff Tool to Compare Language Models
Nov 02, 2021


Abstract:While different language models are ubiquitous in NLP, it is hard to contrast their outputs and identify which contexts one can handle better than the other. To address this question, we introduce LMdiff, a tool that visually compares probability distributions of two models that differ, e.g., through finetuning, distillation, or simply training with different parameter sizes. LMdiff allows the generation of hypotheses about model behavior by investigating text instances token by token and further assists in choosing these interesting text instances by identifying the most interesting phrases from large corpora. We showcase the applicability of LMdiff for hypothesis generation across multiple case studies. A demo is available at http://lmdiff.net .
Accessible Visualization via Natural Language Descriptions: A Four-Level Model of Semantic Content
Oct 08, 2021


Abstract:Natural language descriptions sometimes accompany visualizations to better communicate and contextualize their insights, and to improve their accessibility for readers with disabilities. However, it is difficult to evaluate the usefulness of these descriptions, and how effectively they improve access to meaningful information, because we have little understanding of the semantic content they convey, and how different readers receive this content. In response, we introduce a conceptual model for the semantic content conveyed by natural language descriptions of visualizations. Developed through a grounded theory analysis of 2,147 sentences, our model spans four levels of semantic content: enumerating visualization construction properties (e.g., marks and encodings); reporting statistical concepts and relations (e.g., extrema and correlations); identifying perceptual and cognitive phenomena (e.g., complex trends and patterns); and elucidating domain-specific insights (e.g., social and political context). To demonstrate how our model can be applied to evaluate the effectiveness of visualization descriptions, we conduct a mixed-methods evaluation with 30 blind and 90 sighted readers, and find that these reader groups differ significantly on which semantic content they rank as most useful. Together, our model and findings suggest that access to meaningful information is strongly reader-specific, and that research in automatic visualization captioning should orient toward descriptions that more richly communicate overall trends and statistics, sensitive to reader preferences. Our work further opens a space of research on natural language as a data interface coequal with visualization.
* An accessible HTML version of the article is available at: http://vis.csail.mit.edu/pubs/vis-text-model/
Shared Interest: Large-Scale Visual Analysis of Model Behavior by Measuring Human-AI Alignment
Jul 20, 2021


Abstract:Saliency methods -- techniques to identify the importance of input features on a model's output -- are a common first step in understanding neural network behavior. However, interpreting saliency requires tedious manual inspection to identify and aggregate patterns in model behavior, resulting in ad hoc or cherry-picked analysis. To address these concerns, we present Shared Interest: a set of metrics for comparing saliency with human annotated ground truths. By providing quantitative descriptors, Shared Interest allows ranking, sorting, and aggregation of inputs thereby facilitating large-scale systematic analysis of model behavior. We use Shared Interest to identify eight recurring patterns in model behavior including focusing on a sufficient subset of ground truth features or being distracted by contextual features. Working with representative real-world users, we show how Shared Interest can be used to rapidly develop or lose trust in a model's reliability, uncover issues that are missed in manual analyses, and enable interactive probing of model behavior.
Intuitively Assessing ML Model Reliability through Example-Based Explanations and Editing Model Inputs
Feb 17, 2021


Abstract:Interpretability methods aim to help users build trust in and understand the capabilities of machine learning models. However, existing approaches often rely on abstract, complex visualizations that poorly map to the task at hand or require non-trivial ML expertise to interpret. Here, we present two interface modules to facilitate a more intuitive assessment of model reliability. To help users better characterize and reason about a model's uncertainty, we visualize raw and aggregate information about a given input's nearest neighbors in the training dataset. Using an interactive editor, users can manipulate this input in semantically-meaningful ways, determine the effect on the output, and compare against their prior expectations. We evaluate our interface using an electrocardiogram beat classification case study. Compared to a baseline feature importance interface, we find that 9 physicians are better able to align the model's uncertainty with clinically relevant factors and build intuition about its capabilities and limitations.
 Add to Chrome
 Add to Firefox
 Add to Edge