Benny J. Tang
VisText: A Benchmark for Semantically Rich Chart Captioning
Jun 28, 2023


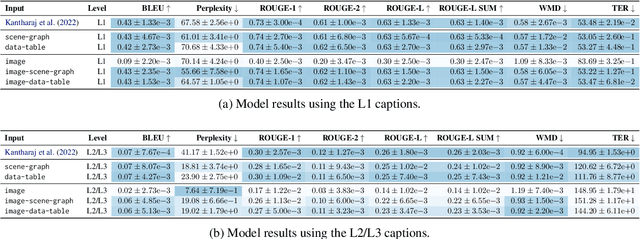
Abstract:Captions that describe or explain charts help improve recall and comprehension of the depicted data and provide a more accessible medium for people with visual disabilities. However, current approaches for automatically generating such captions struggle to articulate the perceptual or cognitive features that are the hallmark of charts (e.g., complex trends and patterns). In response, we introduce VisText: a dataset of 12,441 pairs of charts and captions that describe the charts' construction, report key statistics, and identify perceptual and cognitive phenomena. In VisText, a chart is available as three representations: a rasterized image, a backing data table, and a scene graph -- a hierarchical representation of a chart's visual elements akin to a web page's Document Object Model (DOM). To evaluate the impact of VisText, we fine-tune state-of-the-art language models on our chart captioning task and apply prefix-tuning to produce captions that vary the semantic content they convey. Our models generate coherent, semantically rich captions and perform on par with state-of-the-art chart captioning models across machine translation and text generation metrics. Through qualitative analysis, we identify six broad categories of errors that our models make that can inform future work.
The MIT Supercloud Workload Classification Challenge
Apr 13, 2022


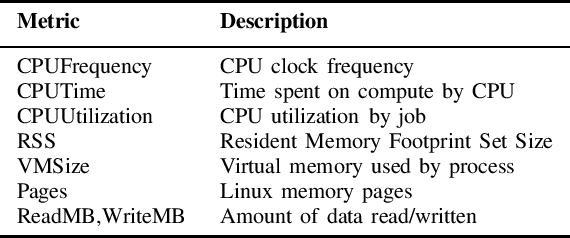
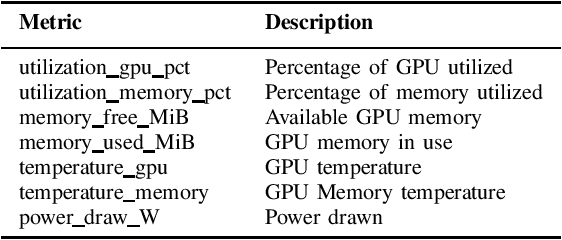
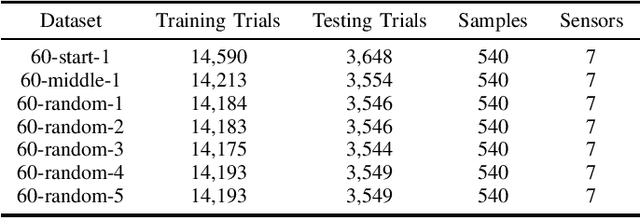
Abstract:High-Performance Computing (HPC) centers and cloud providers support an increasingly diverse set of applications on heterogenous hardware. As Artificial Intelligence (AI) and Machine Learning (ML) workloads have become an increasingly larger share of the compute workloads, new approaches to optimized resource usage, allocation, and deployment of new AI frameworks are needed. By identifying compute workloads and their utilization characteristics, HPC systems may be able to better match available resources with the application demand. By leveraging datacenter instrumentation, it may be possible to develop AI-based approaches that can identify workloads and provide feedback to researchers and datacenter operators for improving operational efficiency. To enable this research, we released the MIT Supercloud Dataset, which provides detailed monitoring logs from the MIT Supercloud cluster. This dataset includes CPU and GPU usage by jobs, memory usage, and file system logs. In this paper, we present a workload classification challenge based on this dataset. We introduce a labelled dataset that can be used to develop new approaches to workload classification and present initial results based on existing approaches. The goal of this challenge is to foster algorithmic innovations in the analysis of compute workloads that can achieve higher accuracy than existing methods. Data and code will be made publicly available via the Datacenter Challenge website : https://dcc.mit.edu.
 Add to Chrome
 Add to Firefox
 Add to Edge