Levent Sagun
Beg to Differ: Understanding Reasoning-Answer Misalignment Across Languages
Dec 27, 2025Abstract:Large language models demonstrate strong reasoning capabilities through chain-of-thought prompting, but whether this reasoning quality transfers across languages remains underexplored. We introduce a human-validated framework to evaluate whether model-generated reasoning traces logically support their conclusions across languages. Analyzing 65k reasoning traces from GlobalMMLU questions across 6 languages and 6 frontier models, we uncover a critical blind spot: while models achieve high task accuracy, their reasoning can fail to support their conclusions. Reasoning traces in non-Latin scripts show at least twice as much misalignment between their reasoning and conclusions than those in Latin scripts. We develop an error taxonomy through human annotation to characterize these failures, finding they stem primarily from evidential errors (unsupported claims, ambiguous facts) followed by illogical reasoning steps. Our findings demonstrate that current multilingual evaluation practices provide an incomplete picture of model reasoning capabilities and highlight the need for reasoning-aware evaluation frameworks.
A Differentiable Rank-Based Objective For Better Feature Learning
Feb 13, 2025Abstract:In this paper, we leverage existing statistical methods to better understand feature learning from data. We tackle this by modifying the model-free variable selection method, Feature Ordering by Conditional Independence (FOCI), which is introduced in \cite{azadkia2021simple}. While FOCI is based on a non-parametric coefficient of conditional dependence, we introduce its parametric, differentiable approximation. With this approximate coefficient of correlation, we present a new algorithm called difFOCI, which is applicable to a wider range of machine learning problems thanks to its differentiable nature and learnable parameters. We present difFOCI in three contexts: (1) as a variable selection method with baseline comparisons to FOCI, (2) as a trainable model parametrized with a neural network, and (3) as a generic, widely applicable neural network regularizer, one that improves feature learning with better management of spurious correlations. We evaluate difFOCI on increasingly complex problems ranging from basic variable selection in toy examples to saliency map comparisons in convolutional networks. We then show how difFOCI can be incorporated in the context of fairness to facilitate classifications without relying on sensitive data.
Chained Tuning Leads to Biased Forgetting
Dec 21, 2024


Abstract:Large language models (LLMs) are often fine-tuned for use on downstream tasks, though this can degrade capabilities learned during previous training. This phenomenon, often referred to as catastrophic forgetting, has important potential implications for the safety of deployed models. In this work, we first show that models trained on downstream tasks forget their safety tuning to a greater extent than models trained in the opposite order.Second, we show that forgetting disproportionately impacts safety information about certain groups. To quantify this phenomenon, we define a new metric we term biased forgetting. We conduct a systematic evaluation of the effects of task ordering on forgetting and apply mitigations that can help the model recover from the forgetting observed. We hope our findings can better inform methods for chaining the finetuning of LLMs in continual learning settings to enable training of safer and less toxic models.
On the Role of Speech Data in Reducing Toxicity Detection Bias
Nov 12, 2024


Abstract:Text toxicity detection systems exhibit significant biases, producing disproportionate rates of false positives on samples mentioning demographic groups. But what about toxicity detection in speech? To investigate the extent to which text-based biases are mitigated by speech-based systems, we produce a set of high-quality group annotations for the multilingual MuTox dataset, and then leverage these annotations to systematically compare speech- and text-based toxicity classifiers. Our findings indicate that access to speech data during inference supports reduced bias against group mentions, particularly for ambiguous and disagreement-inducing samples. Our results also suggest that improving classifiers, rather than transcription pipelines, is more helpful for reducing group bias. We publicly release our annotations and provide recommendations for future toxicity dataset construction.
The Root Shapes the Fruit: On the Persistence of Gender-Exclusive Harms in Aligned Language Models
Nov 06, 2024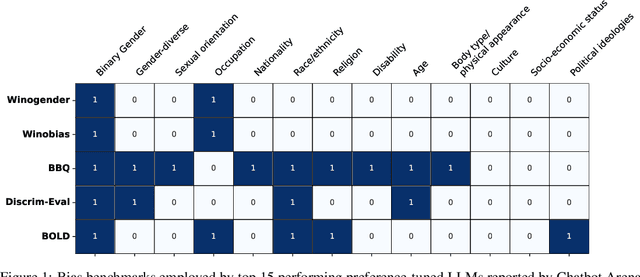
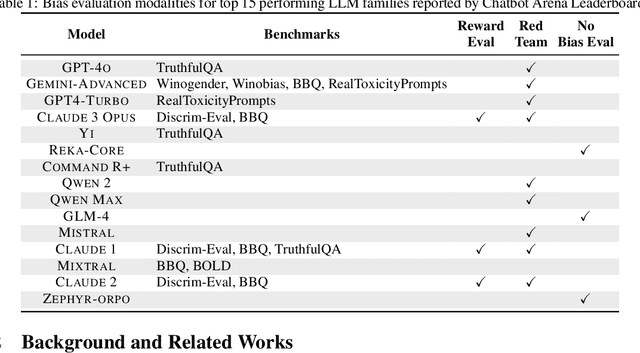
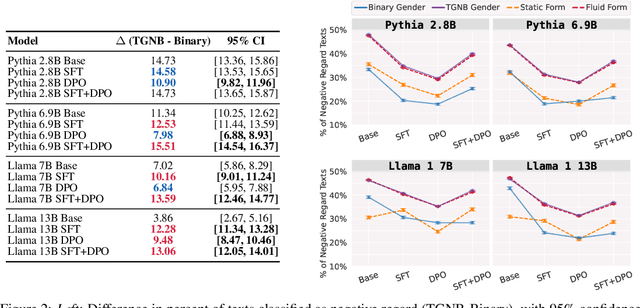

Abstract:Natural-language assistants are designed to provide users with helpful responses while avoiding harmful outputs, largely achieved through alignment to human preferences. Yet there is limited understanding of whether alignment techniques may inadvertently perpetuate or even amplify harmful biases inherited from their pre-aligned base models. This issue is compounded by the choice of bias evaluation benchmarks in popular preference-finetuned models, which predominantly focus on dominant social categories, such as binary gender, thereby limiting insights into biases affecting underrepresented groups. Towards addressing this gap, we center transgender, nonbinary, and other gender-diverse identities to investigate how alignment procedures interact with pre-existing gender-diverse bias in LLMs. Our key contributions include: 1) a comprehensive survey of bias evaluation modalities across leading preference-finetuned LLMs, highlighting critical gaps in gender-diverse representation, 2) systematic evaluation of gender-diverse biases across 12 models spanning Direct Preference Optimization (DPO) stages, uncovering harms popular bias benchmarks fail to detect, and 3) a flexible framework for measuring harmful biases in implicit reward signals applicable to other social contexts. Our findings reveal that DPO-aligned models are particularly sensitive to supervised finetuning (SFT), and can amplify two forms of real-world gender-diverse harms from their base models: stigmatization and gender non-affirmative language. We conclude with recommendations tailored to DPO and broader alignment practices, advocating for the adoption of community-informed bias evaluation frameworks to more effectively identify and address underrepresented harms in LLMs.
Reassessing the Validity of Spurious Correlations Benchmarks
Sep 06, 2024


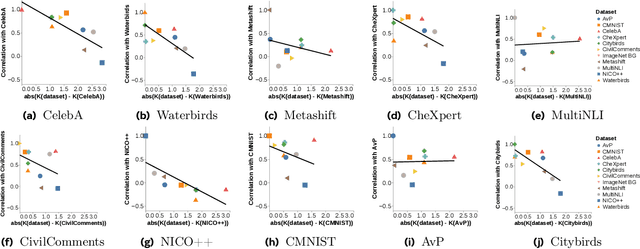
Abstract:Neural networks can fail when the data contains spurious correlations. To understand this phenomenon, researchers have proposed numerous spurious correlations benchmarks upon which to evaluate mitigation methods. However, we observe that these benchmarks exhibit substantial disagreement, with the best methods on one benchmark performing poorly on another. We explore this disagreement, and examine benchmark validity by defining three desiderata that a benchmark should satisfy in order to meaningfully evaluate methods. Our results have implications for both benchmarks and mitigations: we find that certain benchmarks are not meaningful measures of method performance, and that several methods are not sufficiently robust for widespread use. We present a simple recipe for practitioners to choose methods using the most similar benchmark to their given problem.
Networked Inequality: Preferential Attachment Bias in Graph Neural Network Link Prediction
Sep 29, 2023
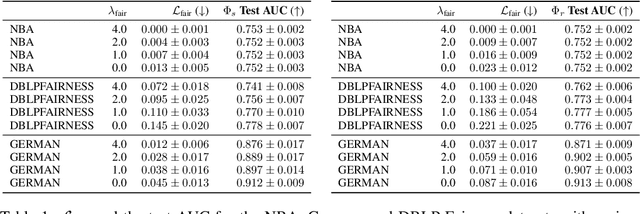
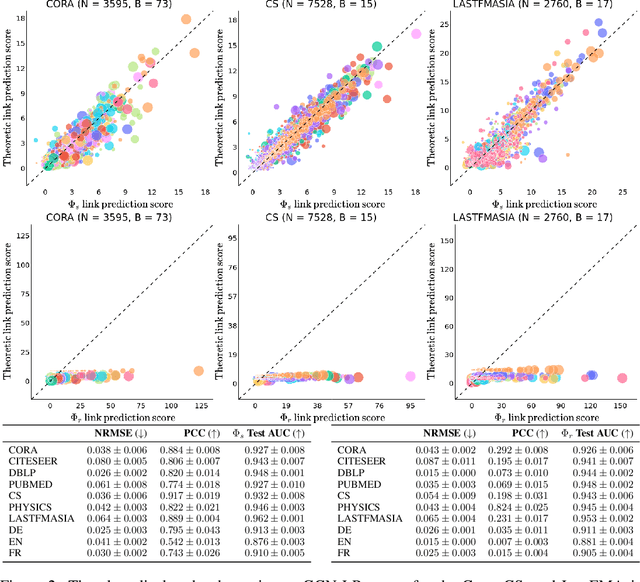
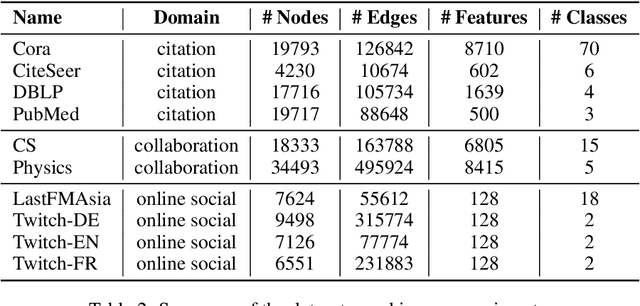
Abstract:Graph neural network (GNN) link prediction is increasingly deployed in citation, collaboration, and online social networks to recommend academic literature, collaborators, and friends. While prior research has investigated the dyadic fairness of GNN link prediction, the within-group fairness and ``rich get richer'' dynamics of link prediction remain underexplored. However, these aspects have significant consequences for degree and power imbalances in networks. In this paper, we shed light on how degree bias in networks affects Graph Convolutional Network (GCN) link prediction. In particular, we theoretically uncover that GCNs with a symmetric normalized graph filter have a within-group preferential attachment bias. We validate our theoretical analysis on real-world citation, collaboration, and online social networks. We further bridge GCN's preferential attachment bias with unfairness in link prediction and propose a new within-group fairness metric. This metric quantifies disparities in link prediction scores between social groups, towards combating the amplification of degree and power disparities. Finally, we propose a simple training-time strategy to alleviate within-group unfairness, and we show that it is effective on citation, online social, and credit networks.
Weisfeiler and Lehman Go Measurement Modeling: Probing the Validity of the WL Test
Jul 11, 2023Abstract:The expressive power of graph neural networks is usually measured by comparing how many pairs of graphs or nodes an architecture can possibly distinguish as non-isomorphic to those distinguishable by the $k$-dimensional Weisfeiler-Lehman ($k$-WL) test. In this paper, we uncover misalignments between practitioners' conceptualizations of expressive power and $k$-WL through a systematic analysis of the reliability and validity of $k$-WL. We further conduct a survey ($n = 18$) of practitioners to surface their conceptualizations of expressive power and their assumptions about $k$-WL. In contrast to practitioners' opinions, our analysis (which draws from graph theory and benchmark auditing) reveals that $k$-WL does not guarantee isometry, can be irrelevant to real-world graph tasks, and may not promote generalization or trustworthiness. We argue for extensional definitions and measurement of expressive power based on benchmarks; we further contribute guiding questions for constructing such benchmarks, which is critical for progress in graph machine learning.
Simplicity Bias Leads to Amplified Performance Disparities
Dec 13, 2022


Abstract:The simple idea that not all things are equally difficult has surprising implications when applied in a fairness context. In this work we explore how "difficulty" is model-specific, such that different models find different parts of a dataset challenging. When difficulty correlates with group information, we term this difficulty disparity. Drawing a connection with recent work exploring the inductive bias towards simplicity of SGD-trained models, we show that when such a disparity exists, it is further amplified by commonly-used models. We quantify this amplification factor across a range of settings aiming towards a fuller understanding of the role of model bias. We also present a challenge to the simplifying assumption that "fixing" a dataset is sufficient to ensure unbiased performance.
Measuring and signing fairness as performance under multiple stakeholder distributions
Jul 20, 2022Abstract:As learning machines increase their influence on decisions concerning human lives, analyzing their fairness properties becomes a subject of central importance. Yet, our best tools for measuring the fairness of learning systems are rigid fairness metrics encapsulated as mathematical one-liners, offer limited power to the stakeholders involved in the prediction task, and are easy to manipulate when we exhort excessive pressure to optimize them. To advance these issues, we propose to shift focus from shaping fairness metrics to curating the distributions of examples under which these are computed. In particular, we posit that every claim about fairness should be immediately followed by the tagline "Fair under what examples, and collected by whom?". By highlighting connections to the literature in domain generalization, we propose to measure fairness as the ability of the system to generalize under multiple stress tests -- distributions of examples with social relevance. We encourage each stakeholder to curate one or multiple stress tests containing examples reflecting their (possibly conflicting) interests. The machine passes or fails each stress test by falling short of or exceeding a pre-defined metric value. The test results involve all stakeholders in a discussion about how to improve the learning system, and provide flexible assessments of fairness dependent on context and based on interpretable data. We provide full implementation guidelines for stress testing, illustrate both the benefits and shortcomings of this framework, and introduce a cryptographic scheme to enable a degree of prediction accountability from system providers.
 Add to Chrome
 Add to Firefox
 Add to Edge