Xiangyang He
GPT-ImgEval: A Comprehensive Benchmark for Diagnosing GPT4o in Image Generation
Apr 03, 2025


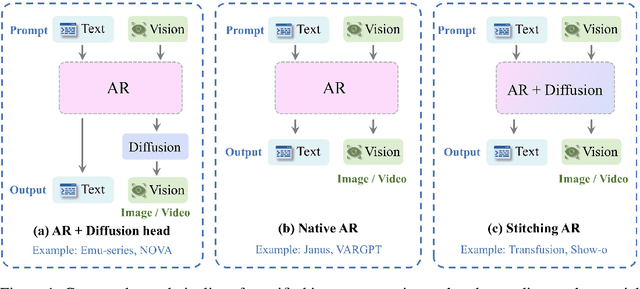
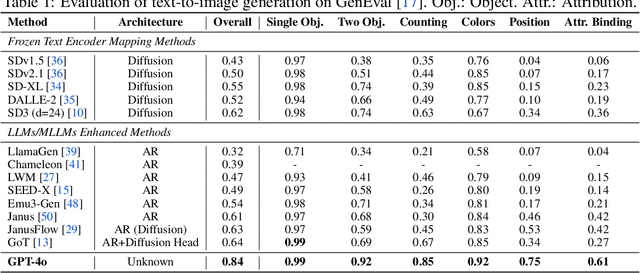
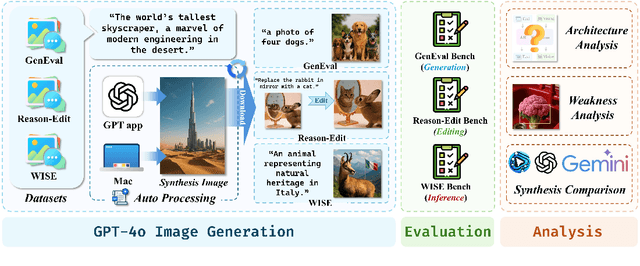
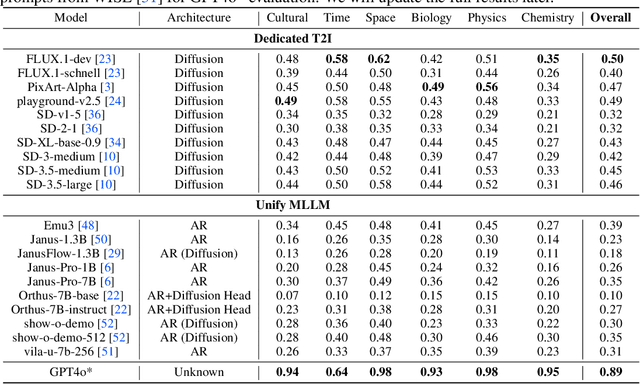
Abstract:The recent breakthroughs in OpenAI's GPT4o model have demonstrated surprisingly good capabilities in image generation and editing, resulting in significant excitement in the community. This technical report presents the first-look evaluation benchmark (named GPT-ImgEval), quantitatively and qualitatively diagnosing GPT-4o's performance across three critical dimensions: (1) generation quality, (2) editing proficiency, and (3) world knowledge-informed semantic synthesis. Across all three tasks, GPT-4o demonstrates strong performance, significantly surpassing existing methods in both image generation control and output quality, while also showcasing exceptional knowledge reasoning capabilities. Furthermore, based on the GPT-4o's generated data, we propose a classification-model-based approach to investigate the underlying architecture of GPT-4o, where our empirical results suggest the model consists of an auto-regressive (AR) combined with a diffusion-based head for image decoding, rather than the VAR-like architectures. We also provide a complete speculation on GPT-4o's overall architecture. In addition, we conduct a series of analyses to identify and visualize GPT-4o's specific limitations and the synthetic artifacts commonly observed in its image generation. We also present a comparative study of multi-round image editing between GPT-4o and Gemini 2.0 Flash, and discuss the safety implications of GPT-4o's outputs, particularly their detectability by existing image forensic models. We hope that our work can offer valuable insight and provide a reliable benchmark to guide future research, foster reproducibility, and accelerate innovation in the field of image generation and beyond. The codes and datasets used for evaluating GPT-4o can be found at https://github.com/PicoTrex/GPT-ImgEval.
MSFormer: A Skeleton-multiview Fusion Method For Tooth Instance Segmentation
Oct 23, 2023Abstract:Recently, deep learning-based tooth segmentation methods have been limited by the expensive and time-consuming processes of data collection and labeling. Achieving high-precision segmentation with limited datasets is critical. A viable solution to this entails fine-tuning pre-trained multiview-based models, thereby enhancing performance with limited data. However, relying solely on two-dimensional (2D) images for three-dimensional (3D) tooth segmentation can produce suboptimal outcomes because of occlusion and deformation, i.e., incomplete and distorted shape perception. To improve this fine-tuning-based solution, this paper advocates 2D-3D joint perception. The fundamental challenge in employing 2D-3D joint perception with limited data is that the 3D-related inputs and modules must follow a lightweight policy instead of using huge 3D data and parameter-rich modules that require extensive training data. Following this lightweight policy, this paper selects skeletons as the 3D inputs and introduces MSFormer, a novel method for tooth segmentation. MSFormer incorporates two lightweight modules into existing multiview-based models: a 3D-skeleton perception module to extract 3D perception from skeletons and a skeleton-image contrastive learning module to obtain the 2D-3D joint perception by fusing both multiview and skeleton perceptions. The experimental results reveal that MSFormer paired with large pre-trained multiview models achieves state-of-the-art performance, requiring only 100 training meshes. Furthermore, the segmentation accuracy is improved by 2.4%-5.5% with the increasing volume of training data.
voxel2vec: A Natural Language Processing Approach to Learning Distributed Representations for Scientific Data
Jul 11, 2022


Abstract:Relationships in scientific data, such as the numerical and spatial distribution relations of features in univariate data, the scalar-value combinations' relations in multivariate data, and the association of volumes in time-varying and ensemble data, are intricate and complex. This paper presents voxel2vec, a novel unsupervised representation learning model, which is used to learn distributed representations of scalar values/scalar-value combinations in a low-dimensional vector space. Its basic assumption is that if two scalar values/scalar-value combinations have similar contexts, they usually have high similarity in terms of features. By representing scalar values/scalar-value combinations as symbols, voxel2vec learns the similarity between them in the context of spatial distribution and then allows us to explore the overall association between volumes by transfer prediction. We demonstrate the usefulness and effectiveness of voxel2vec by comparing it with the isosurface similarity map of univariate data and applying the learned distributed representations to feature classification for multivariate data and to association analysis for time-varying and ensemble data.
A Co-analysis Framework for Exploring Multivariate Scientific Data
Aug 19, 2019


Abstract:In complex multivariate data sets, different features usually include diverse associations with different variables, and different variables are associated within different regions. Therefore, exploring the associations between variables and voxels locally becomes necessary to better understand the underlying phenomena. In this paper, we propose a co-analysis framework based on biclusters, which are two subsets of variables and voxels with close scalar-value relationships, to guide the process of visually exploring multivariate data. We first automatically extract all meaningful biclusters, each of which only contains voxels with a similar scalar-value pattern over a subset of variables. These biclusters are organized according to their variable sets, and biclusters in each variable set are further grouped by a similarity metric to reduce redundancy and support diversity during visual exploration. Biclusters are visually represented in coordinated views to facilitate interactive exploration of multivariate data based on the similarity between biclusters and the correlation of scalar values with different variables. Experiments on several representative multivariate scientific data sets demonstrate the effectiveness of our framework in exploring local relationships among variables, biclusters and scalar values in the data.
* 31 pages, 7 figures
Multivariate Spatial Data Visualization: A Survey
Aug 18, 2019


Abstract:Multivariate spatial data plays an important role in computational science and engineering simulations. The potential features and hidden relationships in multivariate data can assist scientists to gain an in-depth understanding of a scientific process, verify a hypothesis and further discover a new physical or chemical law. In this paper, we present a comprehensive survey of the state-of-the-art techniques for multivariate spatial data visualization. We first introduce the basic concept and characteristics of multivariate spatial data, and describe three main tasks in multivariate data visualization: feature classification, fusion visualization, and correlation analysis. Finally, we prospect potential research topics for multivariate data visualization according to the current research.
* 16 pages, 5 figures. Corresponding author: Yubo Tao
 Add to Chrome
 Add to Firefox
 Add to Edge