 Add to Chrome
 Add to Firefox
 Add to Edge
Partial recovery of meter-scale surface weather
Feb 26, 2026Near-surface atmospheric conditions can differ sharply over tens to hundreds of meters due to land cover and topography, yet this variability is absent from current weather analyses and forecasts. It is unclear whether such meter-scale variability reflects irreducibly chaotic dynamics or contains a component predictable from surface characteristics and large-scale atmospheric forcing. Here we show that a substantial, physically coherent component of meter-scale near-surface weather is statistically recoverable from existing observations. By conditioning coarse atmospheric state on sparse surface station measurements and high-resolution Earth observation data, we infer spatially continuous fields of near-surface wind, temperature, and humidity at 10 m resolution across the contiguous United States. Relative to ERA5, the inferred fields reduce wind error by 29% and temperature and dewpoint error by 6%, while explaining substantially more spatial variance at fixed time steps. They also exhibit physically interpretable structure, including urban heat islands, evapotranspiration-driven humidity contrasts, and wind speed differences across land cover types. Our findings expand the frontier of weather modeling by demonstrating a computationally feasible approach to continental-scale meter-resolution inference. More broadly, they illustrate how conditioning coarse dynamical models on static fine-scale features can reveal previously unresolved components of the Earth system.
Conformal Prediction Sets for Instance Segmentation
Feb 10, 2026Current instance segmentation models achieve high performance on average predictions, but lack principled uncertainty quantification: their outputs are not calibrated, and there is no guarantee that a predicted mask is close to the ground truth. To address this limitation, we introduce a conformal prediction algorithm to generate adaptive confidence sets for instance segmentation. Given an image and a pixel coordinate query, our algorithm generates a confidence set of instance predictions for that pixel, with a provable guarantee for the probability that at least one of the predictions has high Intersection-Over-Union (IoU) with the true object instance mask. We apply our algorithm to instance segmentation examples in agricultural field delineation, cell segmentation, and vehicle detection. Empirically, we find that our prediction sets vary in size based on query difficulty and attain the target coverage, outperforming existing baselines such as Learn Then Test, Conformal Risk Control, and morphological dilation-based methods. We provide versions of the algorithm with asymptotic and finite sample guarantees.
Conformal Prediction for Generative Models via Adaptive Cluster-Based Density Estimation
Jan 29, 2026Conditional generative models map input variables to complex, high-dimensional distributions, enabling realistic sample generation in a diverse set of domains. A critical challenge with these models is the absence of calibrated uncertainty, which undermines trust in individual outputs for high-stakes applications. To address this issue, we propose a systematic conformal prediction approach tailored to conditional generative models, leveraging density estimation on model-generated samples. We introduce a novel method called CP4Gen, which utilizes clustering-based density estimation to construct prediction sets that are less sensitive to outliers, more interpretable, and of lower structural complexity than existing methods. Extensive experiments on synthetic datasets and real-world applications, including climate emulation tasks, demonstrate that CP4Gen consistently achieves superior performance in terms of prediction set volume and structural simplicity. Our approach offers practitioners a powerful tool for uncertainty estimation associated with conditional generative models, particularly in scenarios demanding rigorous and interpretable prediction sets.
Masked Mineral Modeling: Continent-Scale Mineral Prospecting via Geospatial Infilling
Nov 12, 2025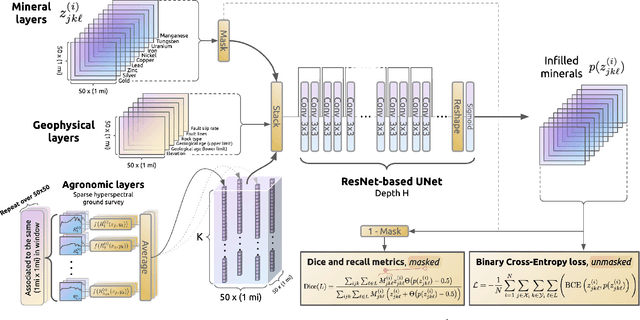
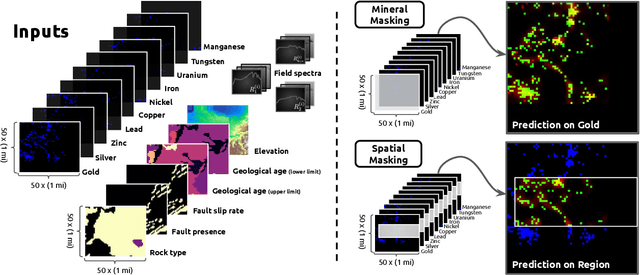
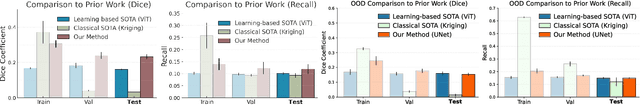
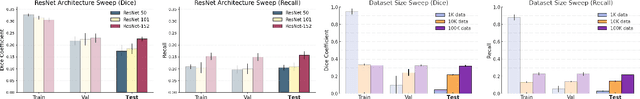
Minerals play a critical role in the advanced energy technologies necessary for decarbonization, but characterizing mineral deposits hidden underground remains costly and challenging. Inspired by recent progress in generative modeling, we develop a learning method which infers the locations of minerals by masking and infilling geospatial maps of resource availability. We demonstrate this technique using mineral data for the conterminous United States, and train performant models, with the best achieving Dice coefficients of $0.31 \pm 0.01$ and recalls of $0.22 \pm 0.02$ on test data at 1$\times$1 mi$^2$ spatial resolution. One major advantage of our approach is that it can easily incorporate auxiliary data sources for prediction which may be more abundant than mineral data. We highlight the capabilities of our model by adding input layers derived from geophysical sources, along with a nation-wide ground survey of soils originally intended for agronomic purposes. We find that employing such auxiliary features can improve inference performance, while also enabling model evaluation in regions with no recorded minerals.
Invariant Features for Global Crop Type Classification
Sep 04, 2025


Accurately obtaining crop type and its spatial distribution at a global scale is critical for food security, agricultural policy-making, and sustainable development. Remote sensing offers an efficient solution for large-scale crop classification, but the limited availability of reliable ground samples in many regions constrains applicability across geographic areas. To address performance declines under geospatial shifts, this study identifies remote sensing features that are invariant to geographic variation and proposes strategies to enhance cross-regional generalization. We construct CropGlobe, a global crop type dataset with 300,000 pixel-level samples from eight countries across five continents, covering six major food and industrial crops (corn, soybeans, rice, wheat, sugarcane, cotton). With broad geographic coverage, CropGlobe enables a systematic evaluation under cross-country, cross-continent, and cross-hemisphere transfer. We compare the transferability of temporal multi-spectral features (Sentinel-2-based 1D/2D median features and harmonic coefficients) and hyperspectral features (from EMIT). To improve generalization under spectral and phenological shifts, we design CropNet, a lightweight and robust CNN tailored for pixel-level crop classification, coupled with temporal data augmentation (time shift, time scale, and magnitude warping) that simulates realistic cross-regional phenology. Experiments show that 2D median temporal features from Sentinel-2 consistently exhibit the strongest invariance across all transfer scenarios, and augmentation further improves robustness, particularly when training data diversity is limited. Overall, the work identifies more invariant feature representations that enhance geographic transferability and suggests a promising path toward scalable, low-cost crop type applications across globally diverse regions.
Prediction-Powered Inference with Imputed Covariates and Nonuniform Sampling
Jan 30, 2025


Machine learning models are increasingly used to produce predictions that serve as input data in subsequent statistical analyses. For example, computer vision predictions of economic and environmental indicators based on satellite imagery are used in downstream regressions; similarly, language models are widely used to approximate human ratings and opinions in social science research. However, failure to properly account for errors in the machine learning predictions renders standard statistical procedures invalid. Prior work uses what we call the Predict-Then-Debias estimator to give valid confidence intervals when machine learning algorithms impute missing variables, assuming a small complete sample from the population of interest. We expand the scope by introducing bootstrap confidence intervals that apply when the complete data is a nonuniform (i.e., weighted, stratified, or clustered) sample and to settings where an arbitrary subset of features is imputed. Importantly, the method can be applied to many settings without requiring additional calculations. We prove that these confidence intervals are valid under no assumptions on the quality of the machine learning model and are no wider than the intervals obtained by methods that do not use machine learning predictions.
Multi-modal graph neural networks for localized off-grid weather forecasting
Oct 16, 2024Urgent applications like wildfire management and renewable energy generation require precise, localized weather forecasts near the Earth's surface. However, weather forecast products from machine learning or numerical weather models are currently generated on a global regular grid, on which a naive interpolation cannot accurately reflect fine-grained weather patterns close to the ground. In this work, we train a heterogeneous graph neural network (GNN) end-to-end to downscale gridded forecasts to off-grid locations of interest. This multi-modal GNN takes advantage of local historical weather observations (e.g., wind, temperature) to correct the gridded weather forecast at different lead times towards locally accurate forecasts. Each data modality is modeled as a different type of node in the graph. Using message passing, the node at the prediction location aggregates information from its heterogeneous neighbor nodes. Experiments using weather stations across the Northeastern United States show that our model outperforms a range of data-driven and non-data-driven off-grid forecasting methods. Our approach demonstrates how the gap between global large-scale weather models and locally accurate predictions can be bridged to inform localized decision-making.
Quantifying uncertainty in area and regression coefficient estimation from remote sensing maps
Jul 18, 2024


Remote sensing map products are used to obtain estimates of environmental quantities, such as deforested area or the effect of conservation zones on deforestation. However, the quality of map products varies, and - because maps are outputs of complex machine learning algorithms that take in a variety of remotely sensed variables as inputs - errors are difficult to characterize. Without capturing the biases that may be present, naive calculations of population-level estimates from such maps are statistically invalid. In this paper, we compare several uncertainty quantification methods - stratification, Olofsson area estimation method, and prediction-powered inference - that combine a small amount of randomly sampled ground truth data with large-scale remote sensing map products to generate statistically valid estimates. Applying these methods across four remote sensing use cases in area and regression coefficient estimation, we find that they result in estimates that are more reliable than naively using the map product as if it were 100% accurate and have lower uncertainty than using only the ground truth and ignoring the map product. Prediction-powered inference uses ground truth data to correct for bias in the map product estimate and (unlike stratification) does not require us to choose a map product before sampling. This is the first work to (1) apply prediction-powered inference to remote sensing estimation tasks, and (2) perform uncertainty quantification on remote sensing regression coefficients without assumptions on the structure of map product errors. To improve the utility of machine learning-generated remote sensing maps for downstream applications, we recommend that map producers provide a holdout ground truth dataset to be used for calibration in uncertainty quantification alongside their maps.
Good at captioning, bad at counting: Benchmarking GPT-4V on Earth observation data
Jan 31, 2024
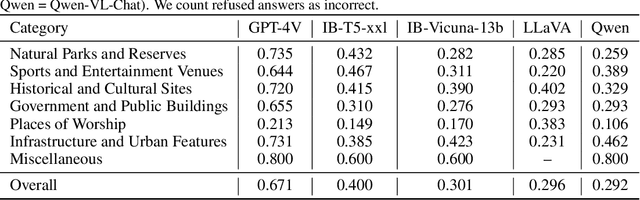

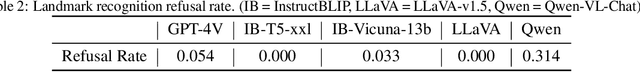
Large Vision-Language Models (VLMs) have demonstrated impressive performance on complex tasks involving visual input with natural language instructions. However, it remains unclear to what extent capabilities on natural images transfer to Earth observation (EO) data, which are predominantly satellite and aerial images less common in VLM training data. In this work, we propose a comprehensive benchmark to gauge the progress of VLMs toward being useful tools for EO data by assessing their abilities on scene understanding, localization and counting, and change detection tasks. Motivated by real-world applications, our benchmark includes scenarios like urban monitoring, disaster relief, land use, and conservation. We discover that, although state-of-the-art VLMs like GPT-4V possess extensive world knowledge that leads to strong performance on open-ended tasks like location understanding and image captioning, their poor spatial reasoning limits usefulness on object localization and counting tasks. Our benchmark will be made publicly available at https://vleo.danielz.ch/ and on Hugging Face at https://huggingface.co/collections/mit-ei/vleo-benchmark-datasets-65b789b0466555489cce0d70 for easy model evaluation.
Taking it further: leveraging pseudo labels for field delineation across label-scarce smallholder regions
Dec 12, 2023


Transfer learning allows for resource-efficient geographic transfer of pre-trained field delineation models. However, the scarcity of labeled data for complex and dynamic smallholder landscapes, particularly in Sub-Saharan Africa, remains a major bottleneck for large-area field delineation. This study explores opportunities of using sparse field delineation pseudo labels for fine-tuning models across geographies and sensor characteristics. We build on a FracTAL ResUNet trained for crop field delineation in India (median field size of 0.24 ha) and use this pre-trained model to generate pseudo labels in Mozambique (median field size of 0.06 ha). We designed multiple pseudo label selection strategies and compared the quantities, area properties, seasonal distribution, and spatial agreement of the pseudo labels against human-annotated training labels (n = 1,512). We then used the human-annotated labels and the pseudo labels for model fine-tuning and compared predictions against human field annotations (n = 2,199). Our results indicate i) a good baseline performance of the pre-trained model in both field delineation and field size estimation, and ii) the added value of regional fine-tuning with performance improvements in nearly all experiments. Moreover, we found iii) substantial performance increases when using only pseudo labels (up to 77% of the IoU increases and 68% of the RMSE decreases obtained by human labels), and iv) additional performance increases when complementing human annotations with pseudo labels. Pseudo labels can be efficiently generated at scale and thus facilitate domain adaptation in label-scarce settings. The workflow presented here is a stepping stone for overcoming the persisting data gaps in heterogeneous smallholder agriculture of Sub-Saharan Africa, where labels are commonly scarce.