Joshua Cape
Testing for latent structure via the Wilcoxon--Wigner random matrix of normalized rank statistics
Dec 21, 2025


Abstract:This paper considers the problem of testing for latent structure in large symmetric data matrices. The goal here is to develop statistically principled methodology that is flexible in its applicability, computationally efficient, and insensitive to extreme data variation, thereby overcoming limitations facing existing approaches. To do so, we introduce and systematically study certain symmetric matrices, called Wilcoxon--Wigner random matrices, whose entries are normalized rank statistics derived from an underlying independent and identically distributed sample of absolutely continuous random variables. These matrices naturally arise as the matricization of one-sample problems in statistics and conceptually lie at the interface of nonparametrics, multivariate analysis, and data reduction. Among our results, we establish that the leading eigenvalue and corresponding eigenvector of Wilcoxon--Wigner random matrices admit asymptotically Gaussian fluctuations with explicit centering and scaling terms. These asymptotic results enable rigorous parameter-free and distribution-free spectral methodology for addressing two hypothesis testing problems, namely community detection and principal submatrix detection. Numerical examples illustrate the performance of the proposed approach. Throughout, our findings are juxtaposed with existing results based on the spectral properties of independent entry symmetric random matrices in signal-plus-noise data settings.
Simultaneous estimation of connectivity and dimensionality in samples of networks
Aug 17, 2025Abstract:An overarching objective in contemporary statistical network analysis is extracting salient information from datasets consisting of multiple networks. To date, considerable attention has been devoted to node and network clustering, while comparatively less attention has been devoted to downstream connectivity estimation and parsimonious embedding dimension selection. Given a sample of potentially heterogeneous networks, this paper proposes a method to simultaneously estimate a latent matrix of connectivity probabilities and its embedding dimensionality or rank after first pre-estimating the number of communities and the node community memberships. The method is formulated as a convex optimization problem and solved using an alternating direction method of multipliers algorithm. We establish estimation error bounds under the Frobenius norm and nuclear norm for settings in which observable networks have blockmodel structure, even when node memberships are imperfectly recovered. When perfect membership recovery is possible and dimensionality is much smaller than the number of communities, the proposed method outperforms conventional averaging-based methods for estimating connectivity and dimensionality. Numerical studies empirically demonstrate the accuracy of our method across various scenarios. Additionally, analysis of a primate brain dataset demonstrates that posited connectivity is not necessarily full rank in practice, illustrating the need for flexible methodology.
Robust spectral clustering with rank statistics
Aug 19, 2024Abstract:This paper analyzes the statistical performance of a robust spectral clustering method for latent structure recovery in noisy data matrices. We consider eigenvector-based clustering applied to a matrix of nonparametric rank statistics that is derived entrywise from the raw, original data matrix. This approach is robust in the sense that, unlike traditional spectral clustering procedures, it can provably recover population-level latent block structure even when the observed data matrix includes heavy-tailed entries and has a heterogeneous variance profile. Our main theoretical contributions are threefold and hold under flexible data generating conditions. First, we establish that robust spectral clustering with rank statistics can consistently recover latent block structure, viewed as communities of nodes in a graph, in the sense that unobserved community memberships for all but a vanishing fraction of nodes are correctly recovered with high probability when the data matrix is large. Second, we refine the former result and further establish that, under certain conditions, the community membership of any individual, specified node of interest can be asymptotically exactly recovered with probability tending to one in the large-data limit. Third, we establish asymptotic normality results associated with the truncated eigenstructure of matrices whose entries are rank statistics, made possible by synthesizing contemporary entrywise matrix perturbation analysis with the classical nonparametric theory of so-called simple linear rank statistics. Collectively, these results demonstrate the statistical utility of rank-based data transformations when paired with spectral techniques for dimensionality reduction. Additionally, for a dataset of human connectomes, our approach yields parsimonious dimensionality reduction and improved recovery of ground-truth neuroanatomical cluster structure.
A statistical framework for GWAS of high dimensional phenotypes using summary statistics, with application to metabolite GWAS
Mar 17, 2023


Abstract:The recent explosion of genetic and high dimensional biobank and 'omic' data has provided researchers with the opportunity to investigate the shared genetic origin (pleiotropy) of hundreds to thousands of related phenotypes. However, existing methods for multi-phenotype genome-wide association studies (GWAS) do not model pleiotropy, are only applicable to a small number of phenotypes, or provide no way to perform inference. To add further complication, raw genetic and phenotype data are rarely observed, meaning analyses must be performed on GWAS summary statistics whose statistical properties in high dimensions are poorly understood. We therefore developed a novel model, theoretical framework, and set of methods to perform Bayesian inference in GWAS of high dimensional phenotypes using summary statistics that explicitly model pleiotropy, beget fast computation, and facilitate the use of biologically informed priors. We demonstrate the utility of our procedure by applying it to metabolite GWAS, where we develop new nonparametric priors for genetic effects on metabolite levels that use known metabolic pathway information and foster interpretable inference at the pathway level.
Spectral embedding and the latent geometry of multipartite networks
Feb 08, 2022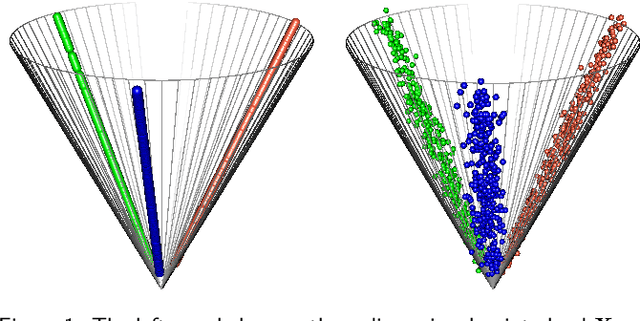
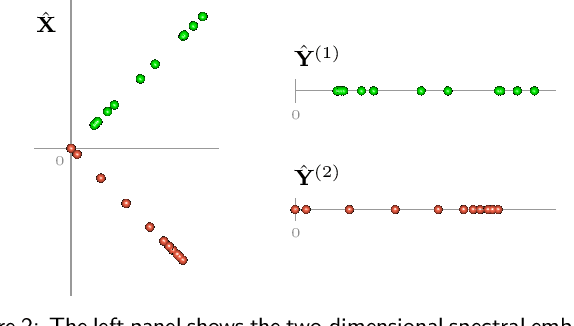
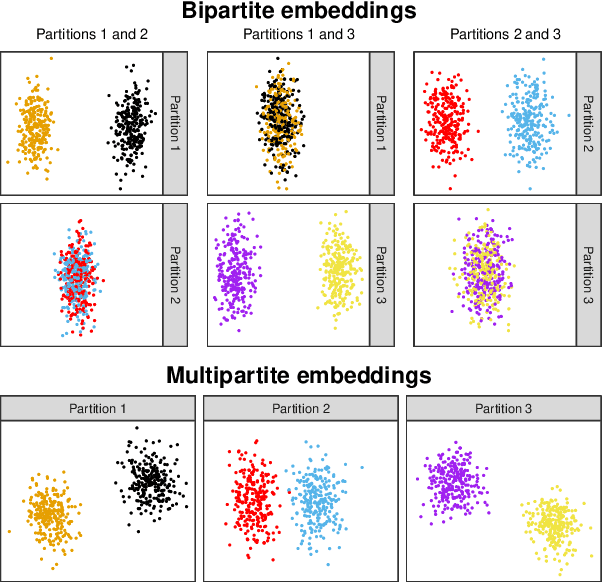
Abstract:Spectral embedding finds vector representations of the nodes of a network, based on the eigenvectors of its adjacency or Laplacian matrix, and has found applications throughout the sciences. Many such networks are multipartite, meaning their nodes can be divided into partitions and nodes of the same partition are never connected. When the network is multipartite, this paper demonstrates that the node representations obtained via spectral embedding live near partition-specific low-dimensional subspaces of a higher-dimensional ambient space. For this reason we propose a follow-on step after spectral embedding, to recover node representations in their intrinsic rather than ambient dimension, proving uniform consistency under a low-rank, inhomogeneous random graph model. Our method naturally generalizes bipartite spectral embedding, in which node representations are obtained by singular value decomposition of the biadjacency or bi-Laplacian matrix.
On identifying unobserved heterogeneity in stochastic blockmodel graphs with vertex covariates
Jul 04, 2020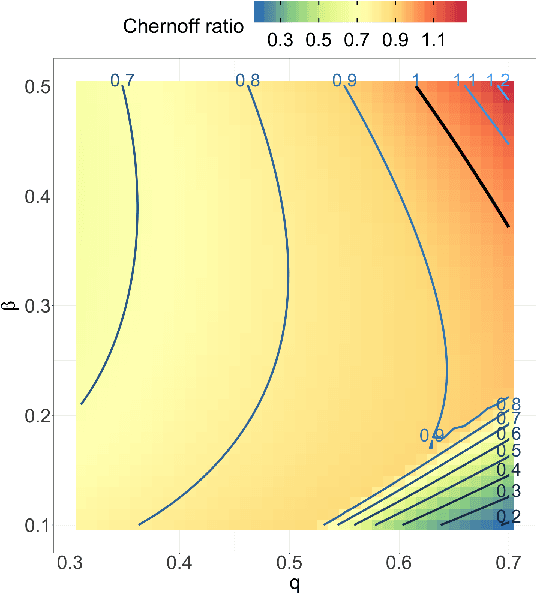
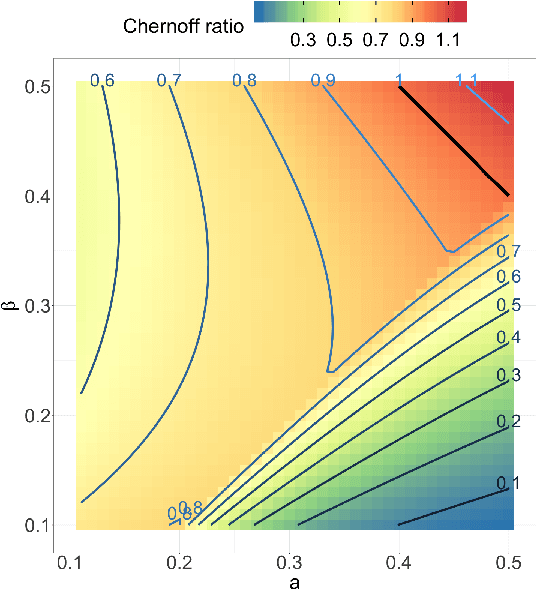
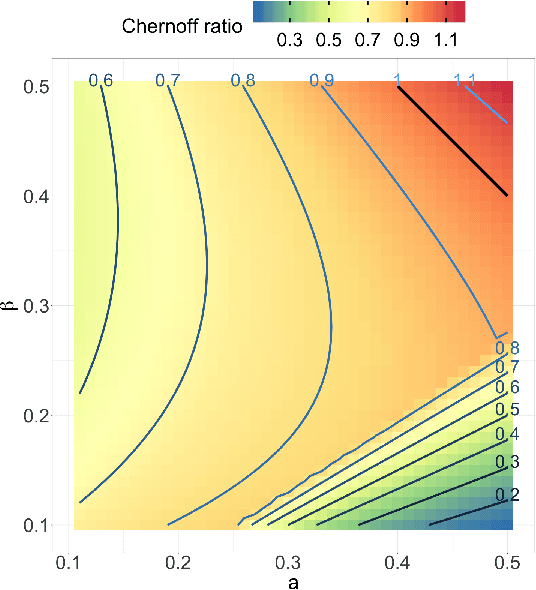
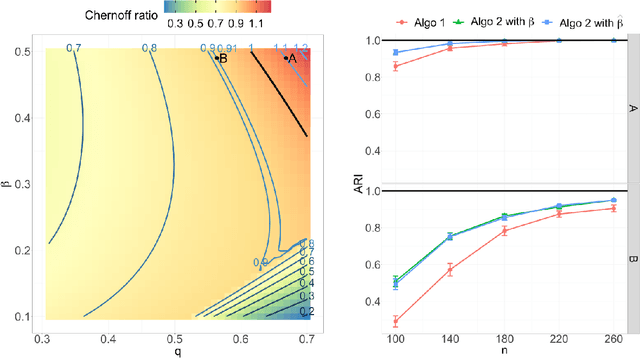
Abstract:Both observed and unobserved vertex heterogeneity can influence block structure in graphs. To assess these effects on block recovery, we present a comparative analysis of two model-based spectral algorithms for clustering vertices in stochastic blockmodel graphs with vertex covariates. The first algorithm directly estimates the induced block assignments by investigating the estimated block connectivity probability matrix including the vertex covariate effect. The second algorithm estimates the vertex covariate effect and then estimates the induced block assignments after accounting for this effect. We employ Chernoff information to analytically compare the algorithms' performance and derive the Chernoff ratio formula for some special models of interest. Analytic results and simulations suggest that, in general, the second algorithm is preferred: we can better estimate the induced block assignments by first estimating the vertex covariate effect. In addition, real data experiments on a diffusion MRI connectome data set indicate that the second algorithm has the advantages of revealing underlying block structure and taking observed vertex heterogeneity into account in real applications. Our findings emphasize the importance of distinguishing between observed and unobserved factors that can affect block structure in graphs.
Spectral inference for large Stochastic Blockmodels with nodal covariates
Aug 18, 2019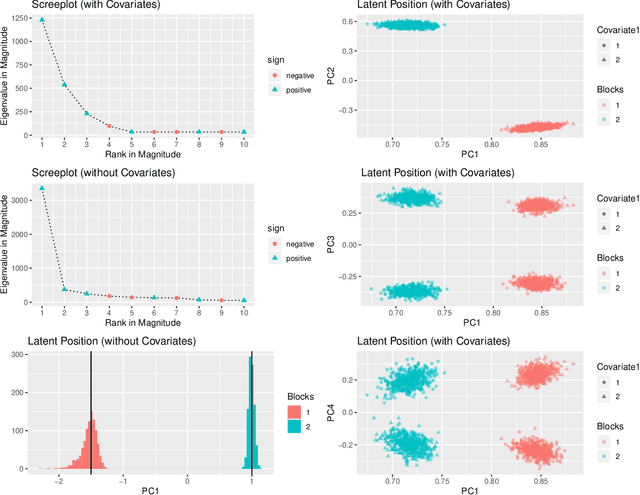
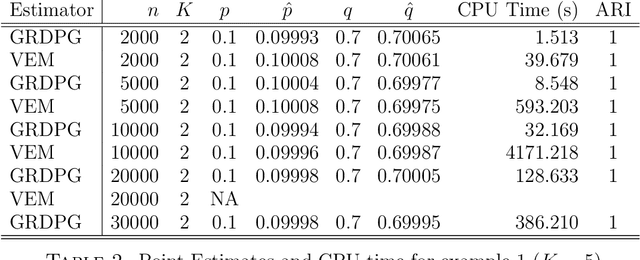

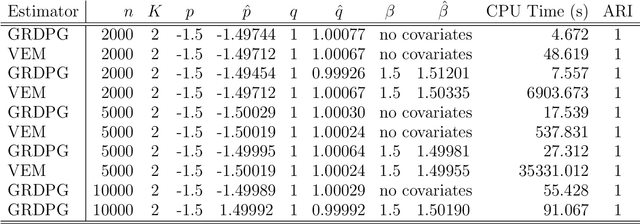
Abstract:In many applications of network analysis, it is important to distinguish between observed and unobserved factors affecting network structure. To this end, we develop spectral estimators for both unobserved blocks and the effect of covariates in stochastic blockmodels. Our main strategy is to reformulate the stochastic blockmodel estimation problem as recovery of latent positions in a generalized random dot product graph. On the theoretical side, we establish asymptotic normality of our estimators for the subsequent purpose of performing inference. On the applied side, we show that computing our estimator is much faster than standard variational expectation--maximization algorithms and scales well for large networks. The results in this paper provide a foundation to estimate the effect of observed covariates as well as unobserved latent community structure on the probability of link formation in networks.
On a 'Two Truths' Phenomenon in Spectral Graph Clustering
Sep 07, 2018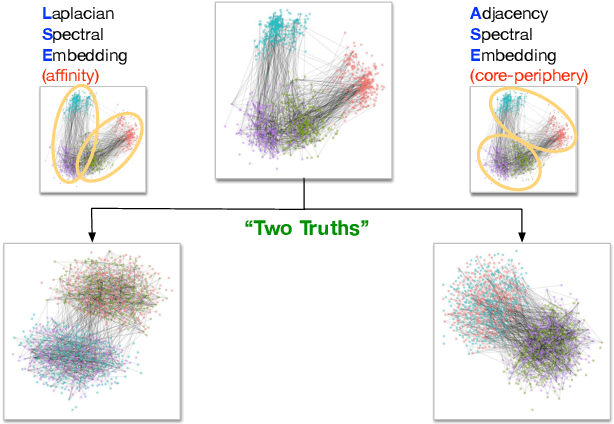
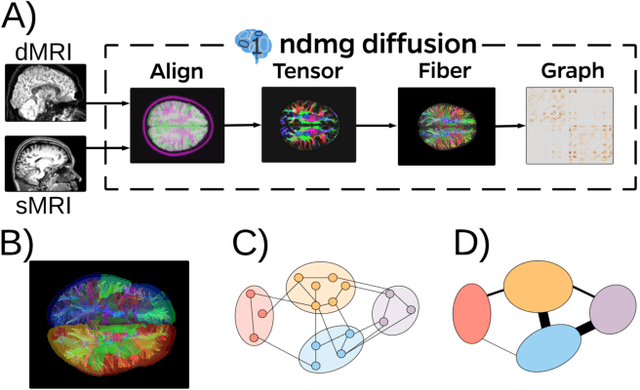
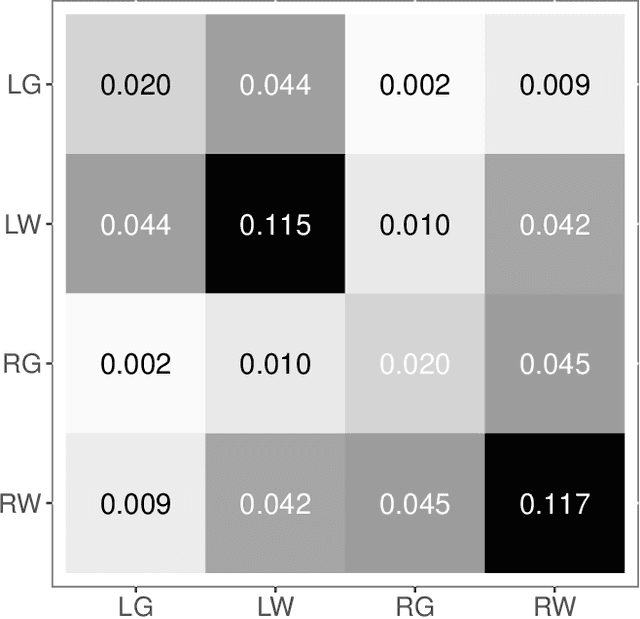
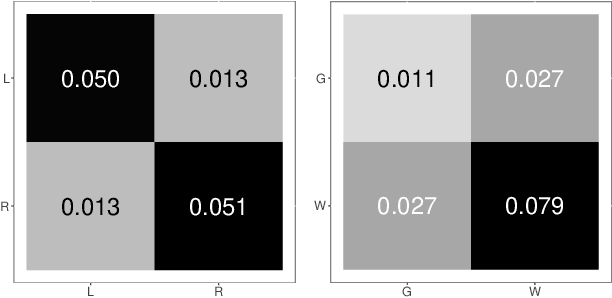
Abstract:Clustering is concerned with coherently grouping observations without any explicit concept of true groupings. Spectral graph clustering - clustering the vertices of a graph based on their spectral embedding - is commonly approached via K-means (or, more generally, Gaussian mixture model) clustering composed with either Laplacian or Adjacency spectral embedding (LSE or ASE). Recent theoretical results provide new understanding of the problem and solutions, and lead us to a 'Two Truths' LSE vs. ASE spectral graph clustering phenomenon convincingly illustrated here via a diffusion MRI connectome data set: the different embedding methods yield different clustering results, with LSE capturing left hemisphere/right hemisphere affinity structure and ASE capturing gray matter/white matter core-periphery structure.
A statistical interpretation of spectral embedding: the generalised random dot product graph
Jul 29, 2018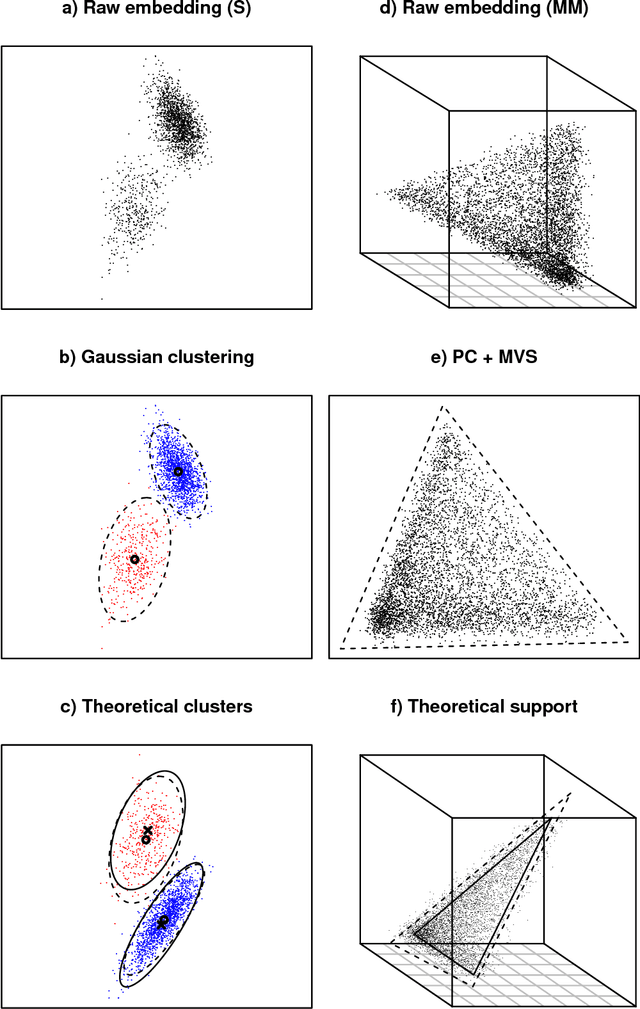
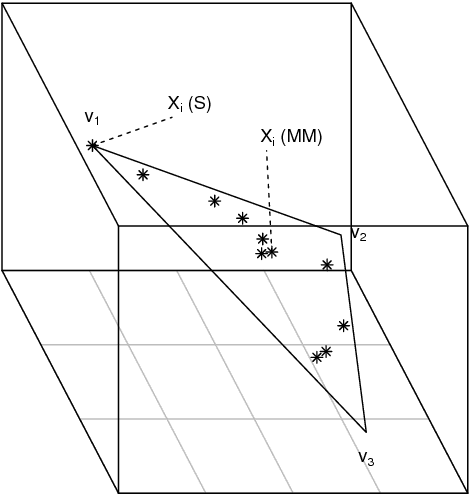
Abstract:A generalisation of a latent position network model known as the random dot product graph model is considered. The resulting model may be of independent interest because it has the unique property of representing a mixture of connectivity behaviours as the corresponding convex combination in latent space. We show that, whether the normalised Laplacian or adjacency matrix is used, the vector representations of nodes obtained by spectral embedding provide strongly consistent latent position estimates with asymptotically Gaussian error. Direct methodological consequences follow from the observation that the well-known mixed membership and standard stochastic block models are special cases where the latent positions live respectively inside or on the vertices of a simplex. Estimation via spectral embedding can therefore be achieved by respectively estimating this simplicial support, or fitting a Gaussian mixture model. In the latter case, the use of $K$-means, as has been previously recommended, is suboptimal and for identifiability reasons unsound. Empirical improvements in link prediction, as well as the potential to uncover much richer latent structure (than available under the mixed membership or standard stochastic block models) are demonstrated in a cyber-security example.
 Add to Chrome
 Add to Firefox
 Add to Edge