Fen Wang
Towards Ancient Plant Seed Classification: A Benchmark Dataset and Baseline Model
Dec 20, 2025Abstract:Understanding the dietary preferences of ancient societies and their evolution across periods and regions is crucial for revealing human-environment interactions. Seeds, as important archaeological artifacts, represent a fundamental subject of archaeobotanical research. However, traditional studies rely heavily on expert knowledge, which is often time-consuming and inefficient. Intelligent analysis methods have made progress in various fields of archaeology, but there remains a research gap in data and methods in archaeobotany, especially in the classification task of ancient plant seeds. To address this, we construct the first Ancient Plant Seed Image Classification (APS) dataset. It contains 8,340 images from 17 genus- or species-level seed categories excavated from 18 archaeological sites across China. In addition, we design a framework specifically for the ancient plant seed classification task (APSNet), which introduces the scale feature (size) of seeds based on learning fine-grained information to guide the network in discovering key "evidence" for sufficient classification. Specifically, we design a Size Perception and Embedding (SPE) module in the encoder part to explicitly extract size information for the purpose of complementing fine-grained information. We propose an Asynchronous Decoupled Decoding (ADD) architecture based on traditional progressive learning to decode features from both channel and spatial perspectives, enabling efficient learning of discriminative features. In both quantitative and qualitative analyses, our approach surpasses existing state-of-the-art image classification methods, achieving an accuracy of 90.5%. This demonstrates that our work provides an effective tool for large-scale, systematic archaeological research.
ChartInsighter: An Approach for Mitigating Hallucination in Time-series Chart Summary Generation with A Benchmark Dataset
Jan 16, 2025


Abstract:Effective chart summary can significantly reduce the time and effort decision makers spend interpreting charts, enabling precise and efficient communication of data insights. Previous studies have faced challenges in generating accurate and semantically rich summaries of time-series data charts. In this paper, we identify summary elements and common hallucination types in the generation of time-series chart summaries, which serve as our guidelines for automatic generation. We introduce ChartInsighter, which automatically generates chart summaries of time-series data, effectively reducing hallucinations in chart summary generation. Specifically, we assign multiple agents to generate the initial chart summary and collaborate iteratively, during which they invoke external data analysis modules to extract insights and compile them into a coherent summary. Additionally, we implement a self-consistency test method to validate and correct our summary. We create a high-quality benchmark of charts and summaries, with hallucination types annotated on a sentence-by-sentence basis, facilitating the evaluation of the effectiveness of reducing hallucinations. Our evaluations using our benchmark show that our method surpasses state-of-the-art models, and that our summary hallucination rate is the lowest, which effectively reduces various hallucinations and improves summary quality. The benchmark is available at https://github.com/wangfen01/ChartInsighter.
Towards Reliable and Explainable AI Model for Solid Pulmonary Nodule Diagnosis
Apr 08, 2022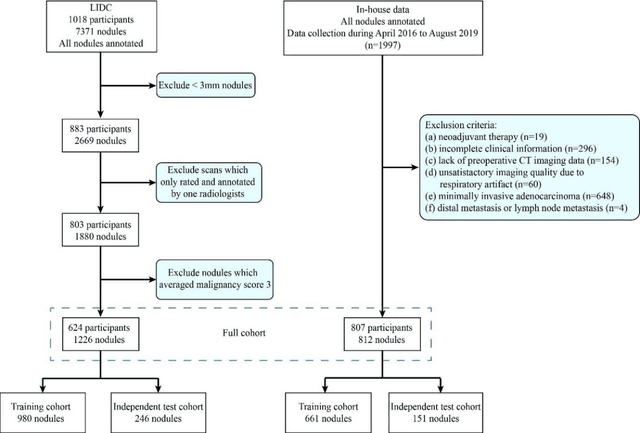
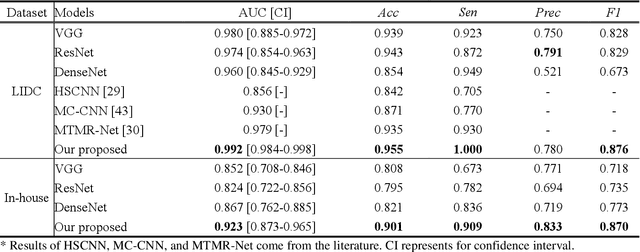
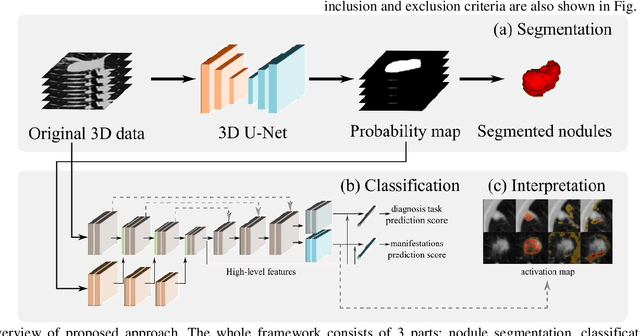

Abstract:Lung cancer has the highest mortality rate of deadly cancers in the world. Early detection is essential to treatment of lung cancer. However, detection and accurate diagnosis of pulmonary nodules depend heavily on the experiences of radiologists and can be a heavy workload for them. Computer-aided diagnosis (CAD) systems have been developed to assist radiologists in nodule detection and diagnosis, greatly easing the workload while increasing diagnosis accuracy. Recent development of deep learning, greatly improved the performance of CAD systems. However, lack of model reliability and interpretability remains a major obstacle for its large-scale clinical application. In this work, we proposed a multi-task explainable deep-learning model for pulmonary nodule diagnosis. Our neural model can not only predict lesion malignancy but also identify relevant manifestations. Further, the location of each manifestation can also be visualized for visual interpretability. Our proposed neural model achieved a test AUC of 0.992 on LIDC public dataset and a test AUC of 0.923 on our in-house dataset. Moreover, our experimental results proved that by incorporating manifestation identification tasks into the multi-task model, the accuracy of the malignancy classification can also be improved. This multi-task explainable model may provide a scheme for better interaction with the radiologists in a clinical environment.
Fast sensor placement by enlarging principle submatrix for large-scale linear inverse problems
Oct 07, 2021
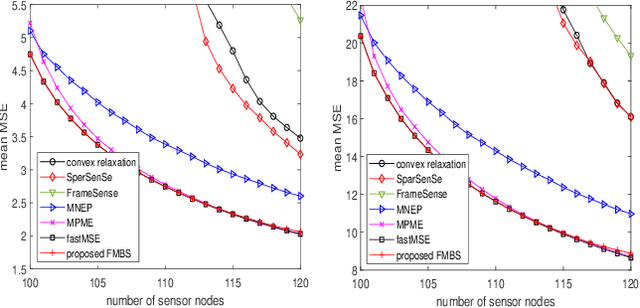
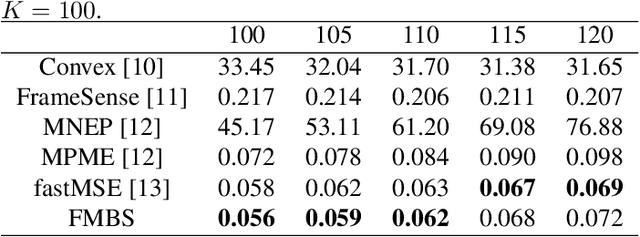
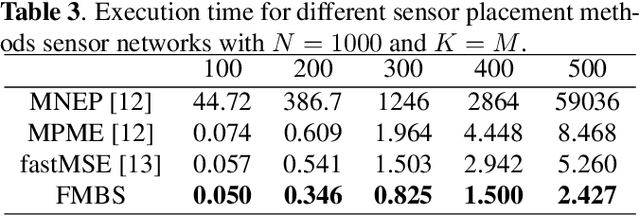
Abstract:Sensor placement for linear inverse problems is the selection of locations to assign sensors so that the entire physical signal can be well recovered from partial observations. In this paper, we propose a fast sampling algorithm to place sensors. Specifically, assuming that the field signal $\mathbf{f}$ is represented by a linear model $\mathbf{f}=\pmb{\phi}\mathbf{g}$, it can be estimated from partial noisy samples via an unbiased least-squares (LS) method, whose expected mean square error (MSE) depends on chosen samples. First, we formulate an approximate MSE problem, and then prove it is equivalent to a problem related to a principle submatrix of $\pmb{\phi}\pmb{\phi}^\top$ indexed by sample set. To solve the formulated problem, we devise a fast greedy algorithm with simple matrix-vector multiplications, leveraging a matrix inverse formula. To further reduce complexity, we reuse results in the previous greedy step for warm start, so that candidates can be evaluated via lightweight vector-vector multiplications. Extensive experiments show that our proposed sensor placement method achieved the lowest sensor sampling time and the best performance compared to state-of-the-art schemes.
Learning Sparse Graph Laplacian with $K$ Eigenvector Prior via Iterative GLASSO and Projection
Oct 25, 2020


Abstract:Learning a suitable graph is an important precursor to many graph signal processing (GSP) pipelines, such as graph spectral signal compression and denoising. Previous graph learning algorithms either i) make some assumptions on connectivity (e.g., graph sparsity), or ii) make simple graph edge assumptions such as positive edges only. In this paper, given an empirical covariance matrix $\bar{C}$ computed from data as input, we consider a structural assumption on the graph Laplacian matrix $L$: the first $K$ eigenvectors of $L$ are pre-selected, e.g., based on domain-specific criteria, such as computation requirement, and the remaining eigenvectors are then learned from data. One example use case is image coding, where the first eigenvector is pre-chosen to be constant, regardless of available observed data. We first prove that the subspace of symmetric positive semi-definite (PSD) matrices $H_{u}^+$ with the first $K$ eigenvectors being $\{u_k\}$ in a defined Hilbert space is a convex cone. We then construct an operator to project a given positive definite (PD) matrix $L$ to $H_{u}^+$, inspired by the Gram-Schmidt procedure. Finally, we design an efficient hybrid graphical lasso/projection algorithm to compute the most suitable graph Laplacian matrix $L^* \in H_{u}^+$ given $\bar{C}$. Experimental results show that given the first $K$ eigenvectors as a prior, our algorithm outperforms competing graph learning schemes using a variety of graph comparison metrics.
 Add to Chrome
 Add to Firefox
 Add to Edge