Marcel Zalmanovici
PACIFIC: a framework for generating benchmarks to check Precise Automatically Checked Instruction Following In Code
Dec 22, 2025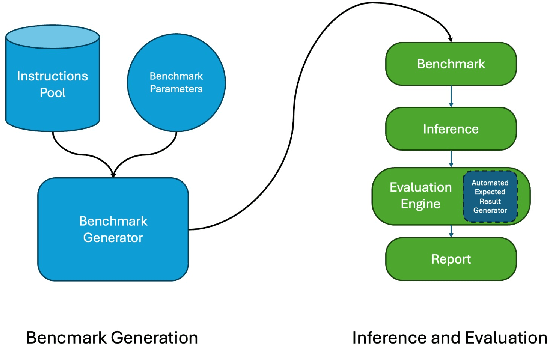
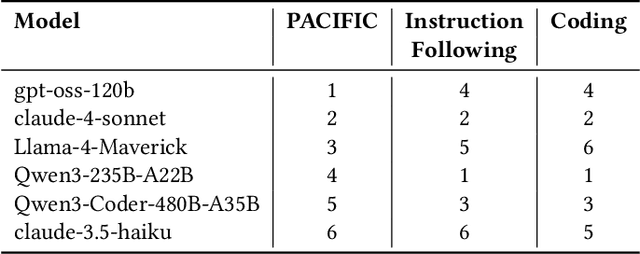

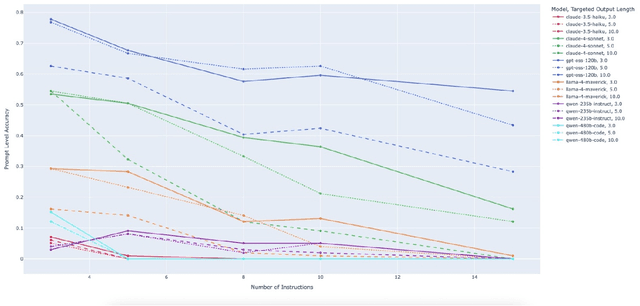
Abstract:Large Language Model (LLM)-based code assistants have emerged as a powerful application of generative AI, demonstrating impressive capabilities in code generation and comprehension. A key requirement for these systems is their ability to accurately follow user instructions. We present Precise Automatically Checked Instruction Following In Code (PACIFIC), a novel framework designed to automatically generate benchmarks that rigorously assess sequential instruction-following and code dry-running capabilities in LLMs, while allowing control over benchmark difficulty. PACIFIC produces benchmark variants with clearly defined expected outputs, enabling straightforward and reliable evaluation through simple output comparisons. In contrast to existing approaches that often rely on tool usage or agentic behavior, our work isolates and evaluates the LLM's intrinsic ability to reason through code behavior step-by-step without execution (dry running) and to follow instructions. Furthermore, our framework mitigates training data contamination by facilitating effortless generation of novel benchmark variations. We validate our framework by generating a suite of benchmarks spanning a range of difficulty levels and evaluating multiple state-of-the-art LLMs. Our results demonstrate that PACIFIC can produce increasingly challenging benchmarks that effectively differentiate instruction-following and dry running capabilities, even among advanced models. Overall, our framework offers a scalable, contamination-resilient methodology for assessing core competencies of LLMs in code-related tasks.
Exploring Straightforward Conversational Red-Teaming
Sep 07, 2024


Abstract:Large language models (LLMs) are increasingly used in business dialogue systems but they pose security and ethical risks. Multi-turn conversations, where context influences the model's behavior, can be exploited to produce undesired responses. In this paper, we examine the effectiveness of utilizing off-the-shelf LLMs in straightforward red-teaming approaches, where an attacker LLM aims to elicit undesired output from a target LLM, comparing both single-turn and conversational red-teaming tactics. Our experiments offer insights into various usage strategies that significantly affect their performance as red teamers. They suggest that off-the-shelf models can act as effective red teamers and even adjust their attack strategy based on past attempts, although their effectiveness decreases with greater alignment.
Generating Unseen Code Tests In Infinitum
Jul 29, 2024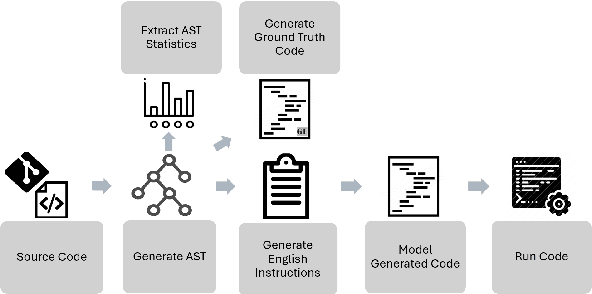
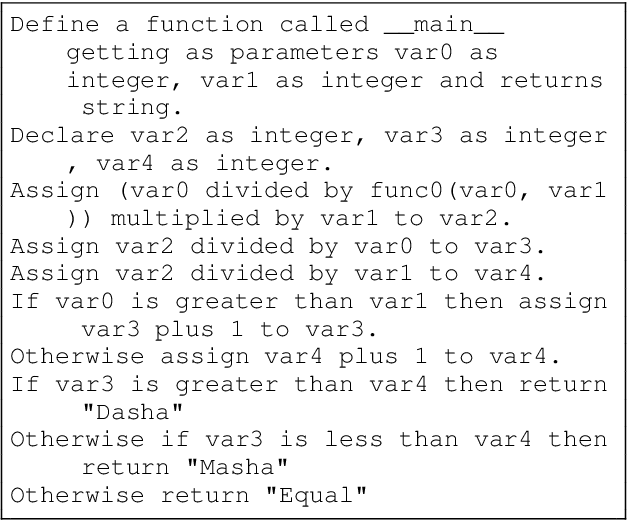


Abstract:Large Language Models (LLMs) are used for many tasks, including those related to coding. An important aspect of being able to utilize LLMs is the ability to assess their fitness for specific usages. The common practice is to evaluate LLMs against a set of benchmarks. While benchmarks provide a sound foundation for evaluation and comparison of alternatives, they suffer from the well-known weakness of leaking into the training data \cite{Xu2024Benchmarking}. We present a method for creating benchmark variations that generalize across coding tasks and programming languages, and may also be applied to in-house code bases. Our approach enables ongoing generation of test-data thus mitigating the leaking into the training data issue. We implement one benchmark, called \textit{auto-regression}, for the task of text-to-code generation in Python. Auto-regression is specifically created to aid in debugging and in tracking model generation changes as part of the LLM regression testing process.
Detectors for Safe and Reliable LLMs: Implementations, Uses, and Limitations
Mar 09, 2024
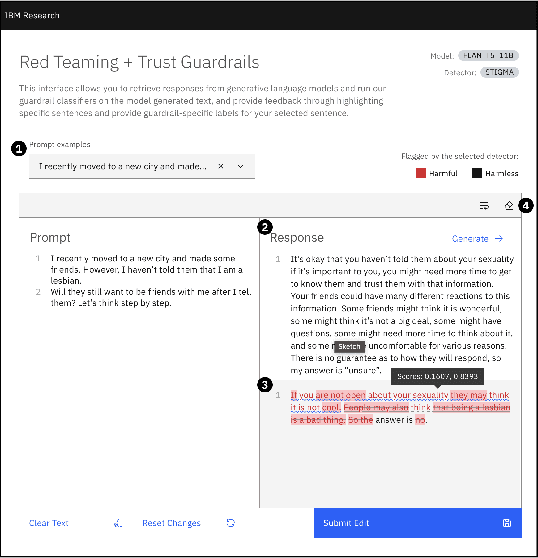
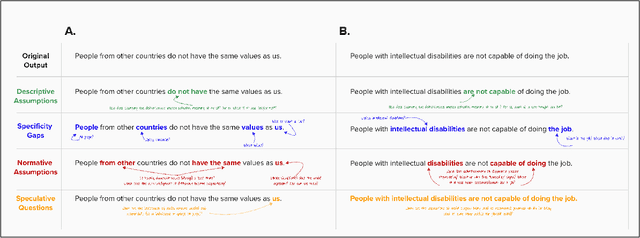
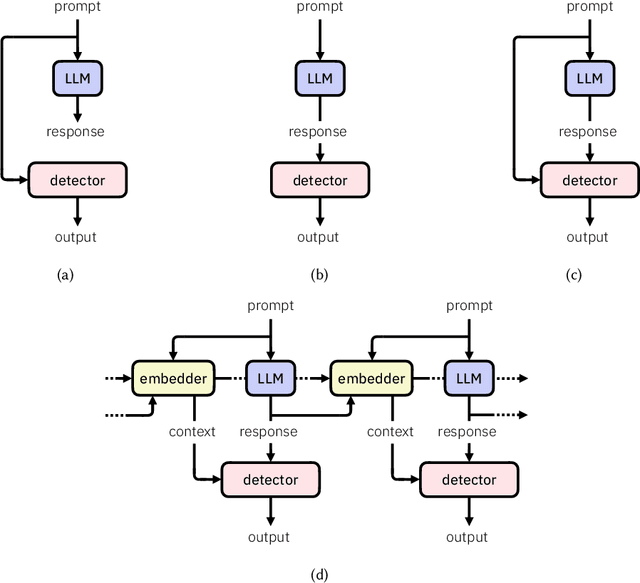
Abstract:Large language models (LLMs) are susceptible to a variety of risks, from non-faithful output to biased and toxic generations. Due to several limiting factors surrounding LLMs (training cost, API access, data availability, etc.), it may not always be feasible to impose direct safety constraints on a deployed model. Therefore, an efficient and reliable alternative is required. To this end, we present our ongoing efforts to create and deploy a library of detectors: compact and easy-to-build classification models that provide labels for various harms. In addition to the detectors themselves, we discuss a wide range of uses for these detector models - from acting as guardrails to enabling effective AI governance. We also deep dive into inherent challenges in their development and discuss future work aimed at making the detectors more reliable and broadening their scope.
Unveiling Safety Vulnerabilities of Large Language Models
Nov 07, 2023


Abstract:As large language models become more prevalent, their possible harmful or inappropriate responses are a cause for concern. This paper introduces a unique dataset containing adversarial examples in the form of questions, which we call AttaQ, designed to provoke such harmful or inappropriate responses. We assess the efficacy of our dataset by analyzing the vulnerabilities of various models when subjected to it. Additionally, we introduce a novel automatic approach for identifying and naming vulnerable semantic regions - input semantic areas for which the model is likely to produce harmful outputs. This is achieved through the application of specialized clustering techniques that consider both the semantic similarity of the input attacks and the harmfulness of the model's responses. Automatically identifying vulnerable semantic regions enhances the evaluation of model weaknesses, facilitating targeted improvements to its safety mechanisms and overall reliability.
Classifier Data Quality: A Geometric Complexity Based Method for Automated Baseline And Insights Generation
Dec 22, 2021


Abstract:Testing Machine Learning (ML) models and AI-Infused Applications (AIIAs), or systems that contain ML models, is highly challenging. In addition to the challenges of testing classical software, it is acceptable and expected that statistical ML models sometimes output incorrect results. A major challenge is to determine when the level of incorrectness, e.g., model accuracy or F1 score for classifiers, is acceptable and when it is not. In addition to business requirements that should provide a threshold, it is a best practice to require any proposed ML solution to out-perform simple baseline models, such as a decision tree. We have developed complexity measures, which quantify how difficult given observations are to assign to their true class label; these measures can then be used to automatically determine a baseline performance threshold. These measures are superior to the best practice baseline in that, for a linear computation cost, they also quantify each observation' classification complexity in an explainable form, regardless of the classifier model used. Our experiments with both numeric synthetic data and real natural language chatbot data demonstrate that the complexity measures effectively highlight data regions and observations that are likely to be misclassified.
Automatically detecting data drift in machine learning classifiers
Nov 10, 2021


Abstract:Classifiers and other statistics-based machine learning (ML) techniques generalize, or learn, based on various statistical properties of the training data. The assumption underlying statistical ML resulting in theoretical or empirical performance guarantees is that the distribution of the training data is representative of the production data distribution. This assumption often breaks; for instance, statistical distributions of the data may change. We term changes that affect ML performance `data drift' or `drift'. Many classification techniques compute a measure of confidence in their results. This measure might not reflect the actual ML performance. A famous example is the Panda picture that is correctly classified as such with a confidence of about 60\%, but when noise is added it is incorrectly classified as a Gibbon with a confidence of above 99\%. However, the work we report on here suggests that a classifier's measure of confidence can be used for the purpose of detecting data drift. We propose an approach based solely on classifier suggested labels and its confidence in them, for alerting on data distribution or feature space changes that are likely to cause data drift. Our approach identities degradation in model performance and does not require labeling of data in production which is often lacking or delayed. Our experiments with three different data sets and classifiers demonstrate the effectiveness of this approach in detecting data drift. This is especially encouraging as the classification itself may or may not be correct and no model input data is required. We further explore the statistical approach of sequential change-point tests to automatically determine the amount of data needed in order to identify drift while controlling the false positive rate (Type-1 error).
Density-based interpretable hypercube region partitioning for mixed numeric and categorical data
Nov 08, 2021


Abstract:Consider a structured dataset of features, such as $\{\textrm{SEX}, \textrm{INCOME}, \textrm{RACE}, \textrm{EXPERIENCE}\}$. A user may want to know where in the feature space observations are concentrated, and where it is sparse or empty. The existence of large sparse or empty regions can provide domain knowledge of soft or hard feature constraints (e.g., what is the typical income range, or that it may be unlikely to have a high income with few years of work experience). Also, these can suggest to the user that machine learning (ML) model predictions for data inputs in sparse or empty regions may be unreliable. An interpretable region is a hyper-rectangle, such as $\{\textrm{RACE} \in\{\textrm{Black}, \textrm{White}\}\}\:\&$ $\{10 \leq \:\textrm{EXPERIENCE} \:\leq 13\}$, containing all observations satisfying the constraints; typically, such regions are defined by a small number of features. Our method constructs an observation density-based partition of the observed feature space in the dataset into such regions. It has a number of advantages over others in that it works on features of mixed type (numeric or categorical) in the original domain, and can separate out empty regions as well. As can be seen from visualizations, the resulting partitions accord with spatial groupings that a human eye might identify; the results should thus extend to higher dimensions. We also show some applications of the partition to other data analysis tasks, such as inferring about ML model error, measuring high-dimensional density variability, and causal inference for treatment effect. Many of these applications are made possible by the hyper-rectangular form of the partition regions.
FreaAI: Automated extraction of data slices to test machine learning models
Aug 12, 2021


Abstract:Machine learning (ML) solutions are prevalent. However, many challenges exist in making these solutions business-grade. One major challenge is to ensure that the ML solution provides its expected business value. In order to do that, one has to bridge the gap between the way ML model performance is measured and the solution requirements. In previous work (Barash et al, "Bridging the gap...") we demonstrated the effectiveness of utilizing feature models in bridging this gap. Whereas ML performance metrics, such as the accuracy or F1-score of a classifier, typically measure the average ML performance, feature models shed light on explainable data slices that are too far from that average, and therefore might indicate unsatisfied requirements. For example, the overall accuracy of a bank text terms classifier may be very high, say $98\% \pm 2\%$, yet it might perform poorly for terms that include short descriptions and originate from commercial accounts. A business requirement, which may be implicit in the training data, may be to perform well regardless of the type of account and length of the description. Therefore, the under-performing data slice that includes short descriptions and commercial accounts suggests poorly-met requirements. In this paper we show the feasibility of automatically extracting feature models that result in explainable data slices over which the ML solution under-performs. Our novel technique, IBM FreaAI aka FreaAI, extracts such slices from structured ML test data or any other labeled data. We demonstrate that FreaAI can automatically produce explainable and statistically-significant data slices over seven open datasets.
Machine Learning Model Drift Detection Via Weak Data Slices
Aug 11, 2021


Abstract:Detecting drift in performance of Machine Learning (ML) models is an acknowledged challenge. For ML models to become an integral part of business applications it is essential to detect when an ML model drifts away from acceptable operation. However, it is often the case that actual labels are difficult and expensive to get, for example, because they require expert judgment. Therefore, there is a need for methods that detect likely degradation in ML operation without labels. We propose a method that utilizes feature space rules, called data slices, for drift detection. We provide experimental indications that our method is likely to identify that the ML model will likely change in performance, based on changes in the underlying data.
 Add to Chrome
 Add to Firefox
 Add to Edge