Bongshin Lee
$C^2$: Scalable Auto-Feedback for LLM-based Chart Generation
Oct 24, 2024


Abstract:Generating high-quality charts with Large Language Models presents significant challenges due to limited data and the high cost of scaling through human curation. Instruction, data, and code triplets are scarce and expensive to manually curate as their creation demands technical expertise. To address this scalability issue, we introduce a reference-free automatic feedback generator, which eliminates the need for costly human intervention. Our novel framework, $C^2$, consists of (1) an automatic feedback provider (ChartAF) and (2) a diverse, reference-free dataset (ChartUIE-8K). Quantitative results are compelling: in our first experiment, 74% of respondents strongly preferred, and 10% preferred, the results after feedback. The second post-feedback experiment demonstrates that ChartAF outperforms nine baselines. Moreover, ChartUIE-8K significantly improves data diversity by increasing queries, datasets, and chart types by 5982%, 1936%, and 91%, respectively, over benchmarks. Finally, an LLM user study revealed that 94% of participants preferred ChartUIE-8K's queries, with 93% deeming them aligned with real-world use cases. Core contributions are available as open-source at an anonymized project site, with ample qualitative examples.
Data Formulator 2: Iteratively Creating Rich Visualizations with AI
Aug 28, 2024


Abstract:To create rich visualizations, data analysts often need to iterate back and forth among data processing and chart specification to achieve their goals. To achieve this, analysts need not only proficiency in data transformation and visualization tools but also efforts to manage the branching history consisting of many different versions of data and charts. Recent LLM-powered AI systems have greatly improved visualization authoring experiences, for example by mitigating manual data transformation barriers via LLMs' code generation ability. However, these systems do not work well for iterative visualization authoring, because they often require analysts to provide, in a single turn, a text-only prompt that fully describes the complex visualization task to be performed, which is unrealistic to both users and models in many cases. In this paper, we present Data Formulator 2, an LLM-powered visualization system to address these challenges. With Data Formulator 2, users describe their visualization intent with blended UI and natural language inputs, and data transformation are delegated to AI. To support iteration, Data Formulator 2 lets users navigate their iteration history and reuse previous designs towards new ones so that they don't need to start from scratch every time. In a user study with eight participants, we observed that Data Formulator 2 allows participants to develop their own iteration strategies to complete challenging data exploration sessions.
Data Formulator: AI-powered Concept-driven Visualization Authoring
Sep 18, 2023


Abstract:With most modern visualization tools, authors need to transform their data into tidy formats to create visualizations they want. Because this requires experience with programming or separate data processing tools, data transformation remains a barrier in visualization authoring. To address this challenge, we present a new visualization paradigm, concept binding, that separates high-level visualization intents and low-level data transformation steps, leveraging an AI agent. We realize this paradigm in Data Formulator, an interactive visualization authoring tool. With Data Formulator, authors first define data concepts they plan to visualize using natural languages or examples, and then bind them to visual channels. Data Formulator then dispatches its AI-agent to automatically transform the input data to surface these concepts and generate desired visualizations. When presenting the results (transformed table and output visualizations) from the AI agent, Data Formulator provides feedback to help authors inspect and understand them. A user study with 10 participants shows that participants could learn and use Data Formulator to create visualizations that involve challenging data transformations, and presents interesting future research directions.
Mystique: Deconstructing SVG Charts for Layout Reuse
Aug 09, 2023


Abstract:To facilitate the reuse of existing charts, previous research has examined how to obtain a semantic understanding of a chart by deconstructing its visual representation into reusable components, such as encodings. However, existing deconstruction approaches primarily focus on chart styles, handling only basic layouts. In this paper, we investigate how to deconstruct chart layouts, focusing on rectangle-based ones, as they cover not only 17 chart types but also advanced layouts (e.g., small multiples, nested layouts). We develop an interactive tool, called Mystique, adopting a mixed-initiative approach to extract the axes and legend, and deconstruct a chart's layout into four semantic components: mark groups, spatial relationships, data encodings, and graphical constraints. Mystique employs a wizard interface that guides chart authors through a series of steps to specify how the deconstructed components map to their own data. On 150 rectangle-based SVG charts, Mystique achieves above 85% accuracy for axis and legend extraction and 96% accuracy for layout deconstruction. In a chart reproduction study, participants could easily reuse existing charts on new datasets. We discuss the current limitations of Mystique and future research directions.
MyMove: Facilitating Older Adults to Collect In-Situ Activity Labels on a Smartwatch with Speech
Apr 01, 2022


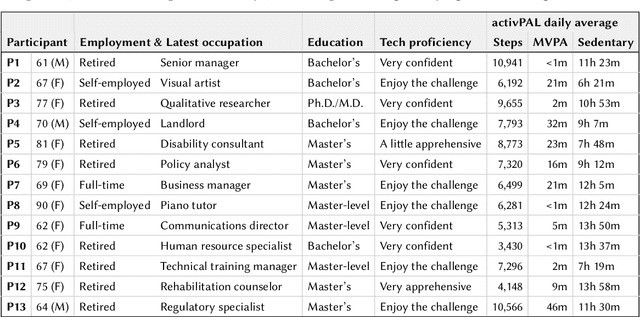
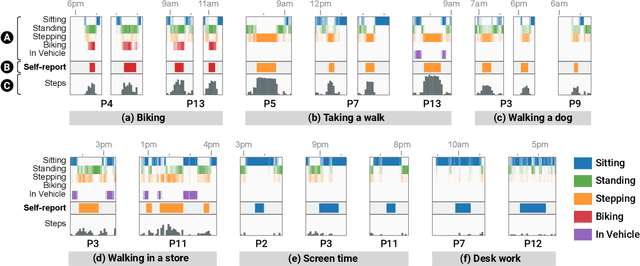
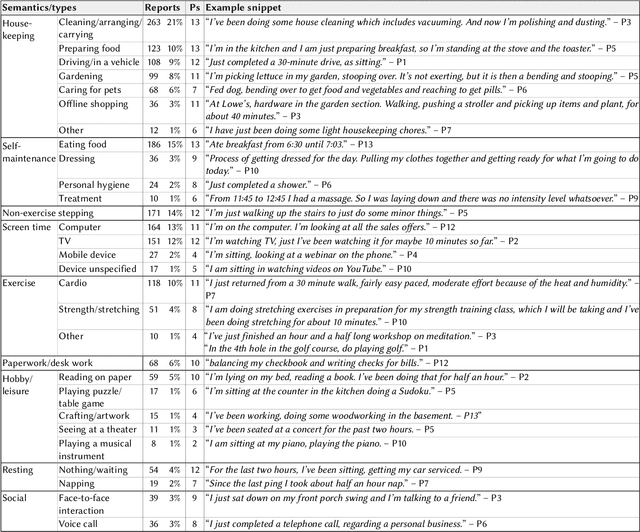
Abstract:Current activity tracking technologies are largely trained on younger adults' data, which can lead to solutions that are not well-suited for older adults. To build activity trackers for older adults, it is crucial to collect training data with them. To this end, we examine the feasibility and challenges with older adults in collecting activity labels by leveraging speech. Specifically, we built MyMove, a speech-based smartwatch app to facilitate the in-situ labeling with a low capture burden. We conducted a 7-day deployment study, where 13 older adults collected their activity labels and smartwatch sensor data, while wearing a thigh-worn activity monitor. Participants were highly engaged, capturing 1,224 verbal reports in total. We extracted 1,885 activities with corresponding effort level and timespan, and examined the usefulness of these reports as activity labels. We discuss the implications of our approach and the collected dataset in supporting older adults through personalized activity tracking technologies.
 Add to Chrome
 Add to Firefox
 Add to Edge