Udo Schlegel
PRSM: A Measure to Evaluate CLIP's Robustness Against Paraphrases
Nov 14, 2025Abstract:Contrastive Language-Image Pre-training (CLIP) is a widely used multimodal model that aligns text and image representations through large-scale training. While it performs strongly on zero-shot and few-shot tasks, its robustness to linguistic variation, particularly paraphrasing, remains underexplored. Paraphrase robustness is essential for reliable deployment, especially in socially sensitive contexts where inconsistent representations can amplify demographic biases. In this paper, we introduce the Paraphrase Ranking Stability Metric (PRSM), a novel measure for quantifying CLIP's sensitivity to paraphrased queries. Using the Social Counterfactuals dataset, a benchmark designed to reveal social and demographic biases, we empirically assess CLIP's stability under paraphrastic variation, examine the interaction between paraphrase robustness and gender, and discuss implications for fairness and equitable deployment of multimodal systems. Our analysis reveals that robustness varies across paraphrasing strategies, with subtle yet consistent differences observed between male- and female-associated queries.
Towards Explainable Deep Clustering for Time Series Data
Jul 28, 2025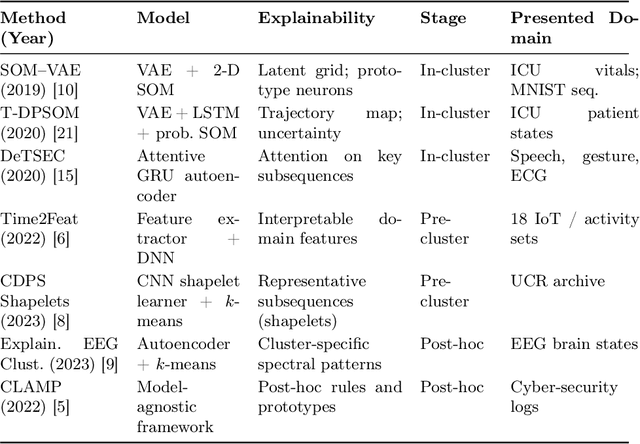
Abstract:Deep clustering uncovers hidden patterns and groups in complex time series data, yet its opaque decision-making limits use in safety-critical settings. This survey offers a structured overview of explainable deep clustering for time series, collecting current methods and their real-world applications. We thoroughly discuss and compare peer-reviewed and preprint papers through application domains across healthcare, finance, IoT, and climate science. Our analysis reveals that most work relies on autoencoder and attention architectures, with limited support for streaming, irregularly sampled, or privacy-preserved series, and interpretability is still primarily treated as an add-on. To push the field forward, we outline six research opportunities: (1) combining complex networks with built-in interpretability; (2) setting up clear, faithfulness-focused evaluation metrics for unsupervised explanations; (3) building explainers that adapt to live data streams; (4) crafting explanations tailored to specific domains; (5) adding human-in-the-loop methods that refine clusters and explanations together; and (6) improving our understanding of how time series clustering models work internally. By making interpretability a primary design goal rather than an afterthought, we propose the groundwork for the next generation of trustworthy deep clustering time series analytics.
My Answer Is NOT 'Fair': Mitigating Social Bias in Vision-Language Models via Fair and Biased Residuals
May 26, 2025Abstract:Social bias is a critical issue in large vision-language models (VLMs), where fairness- and ethics-related problems harm certain groups of people in society. It is unknown to what extent VLMs yield social bias in generative responses. In this study, we focus on evaluating and mitigating social bias on both the model's response and probability distribution. To do so, we first evaluate four state-of-the-art VLMs on PAIRS and SocialCounterfactuals datasets with the multiple-choice selection task. Surprisingly, we find that models suffer from generating gender-biased or race-biased responses. We also observe that models are prone to stating their responses are fair, but indeed having mis-calibrated confidence levels towards particular social groups. While investigating why VLMs are unfair in this study, we observe that VLMs' hidden layers exhibit substantial fluctuations in fairness levels. Meanwhile, residuals in each layer show mixed effects on fairness, with some contributing positively while some lead to increased bias. Based on these findings, we propose a post-hoc method for the inference stage to mitigate social bias, which is training-free and model-agnostic. We achieve this by ablating bias-associated residuals while amplifying fairness-associated residuals on model hidden layers during inference. We demonstrate that our post-hoc method outperforms the competing training strategies, helping VLMs have fairer responses and more reliable confidence levels.
Which LIME should I trust? Concepts, Challenges, and Solutions
Mar 31, 2025Abstract:As neural networks become dominant in essential systems, Explainable Artificial Intelligence (XAI) plays a crucial role in fostering trust and detecting potential misbehavior of opaque models. LIME (Local Interpretable Model-agnostic Explanations) is among the most prominent model-agnostic approaches, generating explanations by approximating the behavior of black-box models around specific instances. Despite its popularity, LIME faces challenges related to fidelity, stability, and applicability to domain-specific problems. Numerous adaptations and enhancements have been proposed to address these issues, but the growing number of developments can be overwhelming, complicating efforts to navigate LIME-related research. To the best of our knowledge, this is the first survey to comprehensively explore and collect LIME's foundational concepts and known limitations. We categorize and compare its various enhancements, offering a structured taxonomy based on intermediate steps and key issues. Our analysis provides a holistic overview of advancements in LIME, guiding future research and helping practitioners identify suitable approaches. Additionally, we provide a continuously updated interactive website (https://patrick-knab.github.io/which-lime-to-trust/), offering a concise and accessible overview of the survey.
Leveraging Color Channel Independence for Improved Unsupervised Object Detection
Dec 19, 2024


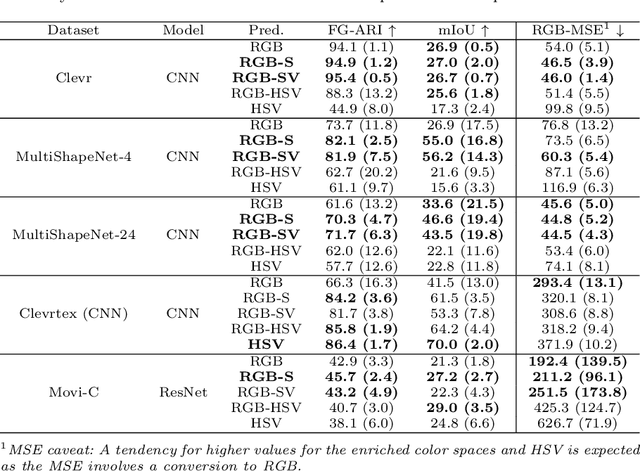
Abstract:Object-centric architectures can learn to extract distinct object representations from visual scenes, enabling downstream applications on the object level. Similarly to autoencoder-based image models, object-centric approaches have been trained on the unsupervised reconstruction loss of images encoded by RGB color spaces. In our work, we challenge the common assumption that RGB images are the optimal color space for unsupervised learning in computer vision. We discuss conceptually and empirically that other color spaces, such as HSV, bear essential characteristics for object-centric representation learning, like robustness to lighting conditions. We further show that models improve when requiring them to predict additional color channels. Specifically, we propose to transform the predicted targets to the RGB-S space, which extends RGB with HSV's saturation component and leads to markedly better reconstruction and disentanglement for five common evaluation datasets. The use of composite color spaces can be implemented with basically no computational overhead, is agnostic of the models' architecture, and is universally applicable across a wide range of visual computing tasks and training types. The findings of our approach encourage additional investigations in computer vision tasks beyond object-centric learning.
Navigating the Maze of Explainable AI: A Systematic Approach to Evaluating Methods and Metrics
Sep 25, 2024Abstract:Explainable AI (XAI) is a rapidly growing domain with a myriad of proposed methods as well as metrics aiming to evaluate their efficacy. However, current studies are often of limited scope, examining only a handful of XAI methods and ignoring underlying design parameters for performance, such as the model architecture or the nature of input data. Moreover, they often rely on one or a few metrics and neglect thorough validation, increasing the risk of selection bias and ignoring discrepancies among metrics. These shortcomings leave practitioners confused about which method to choose for their problem. In response, we introduce LATEC, a large-scale benchmark that critically evaluates 17 prominent XAI methods using 20 distinct metrics. We systematically incorporate vital design parameters like varied architectures and diverse input modalities, resulting in 7,560 examined combinations. Through LATEC, we showcase the high risk of conflicting metrics leading to unreliable rankings and consequently propose a more robust evaluation scheme. Further, we comprehensively evaluate various XAI methods to assist practitioners in selecting appropriate methods aligning with their needs. Curiously, the emerging top-performing method, Expected Gradients, is not examined in any relevant related study. LATEC reinforces its role in future XAI research by publicly releasing all 326k saliency maps and 378k metric scores as a (meta-)evaluation dataset.
Interactive dense pixel visualizations for time series and model attribution explanations
Aug 27, 2024

Abstract:The field of Explainable Artificial Intelligence (XAI) for Deep Neural Network models has developed significantly, offering numerous techniques to extract explanations from models. However, evaluating explanations is often not trivial, and differences in applied metrics can be subtle, especially with non-intelligible data. Thus, there is a need for visualizations tailored to explore explanations for domains with such data, e.g., time series. We propose DAVOTS, an interactive visual analytics approach to explore raw time series data, activations of neural networks, and attributions in a dense-pixel visualization to gain insights into the data, models' decisions, and explanations. To further support users in exploring large datasets, we apply clustering approaches to the visualized data domains to highlight groups and present ordering strategies for individual and combined data exploration to facilitate finding patterns. We visualize a CNN trained on the FordA dataset to demonstrate the approach.
Interactive Counterfactual Generation for Univariate Time Series
Aug 20, 2024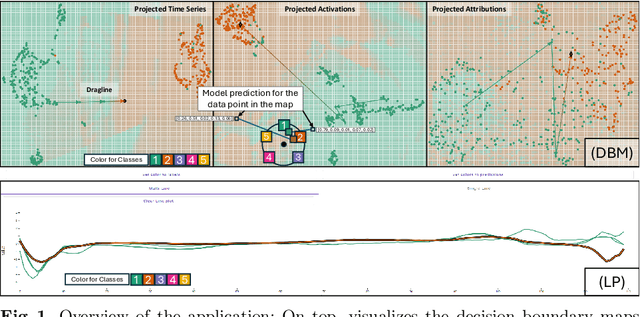
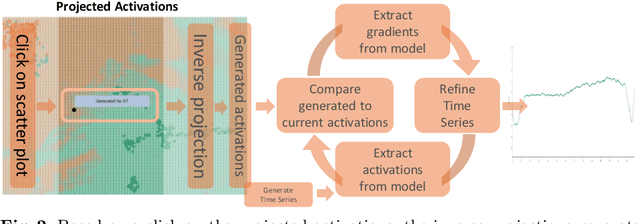
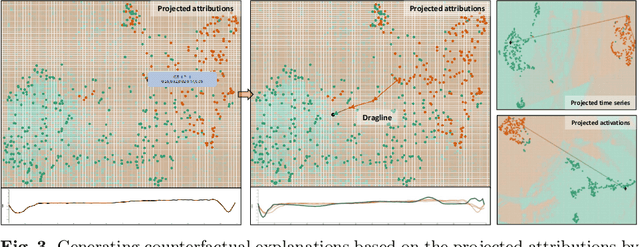
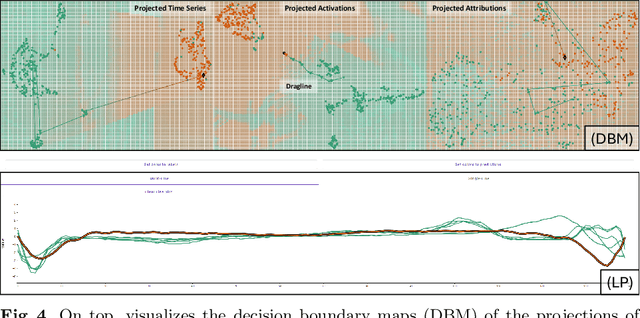
Abstract:We propose an interactive methodology for generating counterfactual explanations for univariate time series data in classification tasks by leveraging 2D projections and decision boundary maps to tackle interpretability challenges. Our approach aims to enhance the transparency and understanding of deep learning models' decision processes. The application simplifies the time series data analysis by enabling users to interactively manipulate projected data points, providing intuitive insights through inverse projection techniques. By abstracting user interactions with the projected data points rather than the raw time series data, our method facilitates an intuitive generation of counterfactual explanations. This approach allows for a more straightforward exploration of univariate time series data, enabling users to manipulate data points to comprehend potential outcomes of hypothetical scenarios. We validate this method using the ECG5000 benchmark dataset, demonstrating significant improvements in interpretability and user understanding of time series classification. The results indicate a promising direction for enhancing explainable AI, with potential applications in various domains requiring transparent and interpretable deep learning models. Future work will explore the scalability of this method to multivariate time series data and its integration with other interpretability techniques.
Finding the DeepDream for Time Series: Activation Maximization for Univariate Time Series
Aug 20, 2024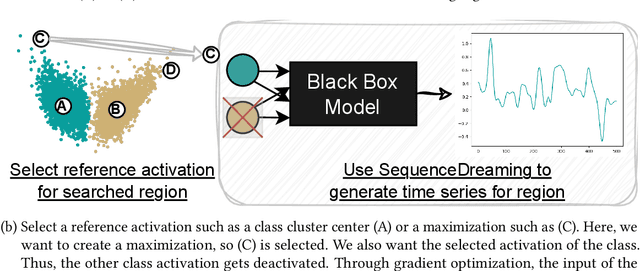

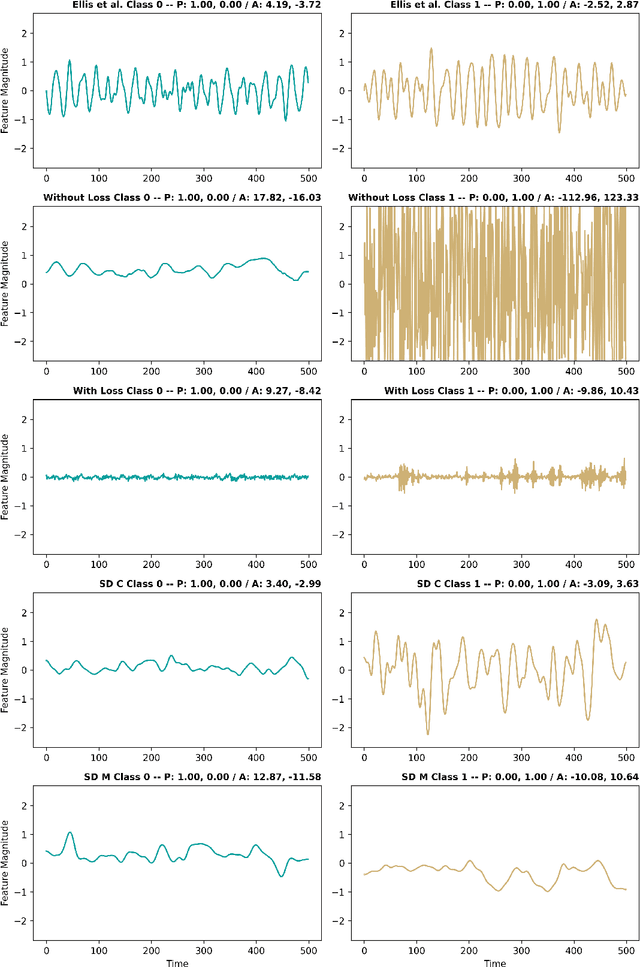

Abstract:Understanding how models process and interpret time series data remains a significant challenge in deep learning to enable applicability in safety-critical areas such as healthcare. In this paper, we introduce Sequence Dreaming, a technique that adapts Activation Maximization to analyze sequential information, aiming to enhance the interpretability of neural networks operating on univariate time series. By leveraging this method, we visualize the temporal dynamics and patterns most influential in model decision-making processes. To counteract the generation of unrealistic or excessively noisy sequences, we enhance Sequence Dreaming with a range of regularization techniques, including exponential smoothing. This approach ensures the production of sequences that more accurately reflect the critical features identified by the neural network. Our approach is tested on a time series classification dataset encompassing applications in predictive maintenance. The results show that our proposed Sequence Dreaming approach demonstrates targeted activation maximization for different use cases so that either centered class or border activation maximization can be generated. The results underscore the versatility of Sequence Dreaming in uncovering salient temporal features learned by neural networks, thereby advancing model transparency and trustworthiness in decision-critical domains.
Introducing the Attribution Stability Indicator: a Measure for Time Series XAI Attributions
Oct 06, 2023
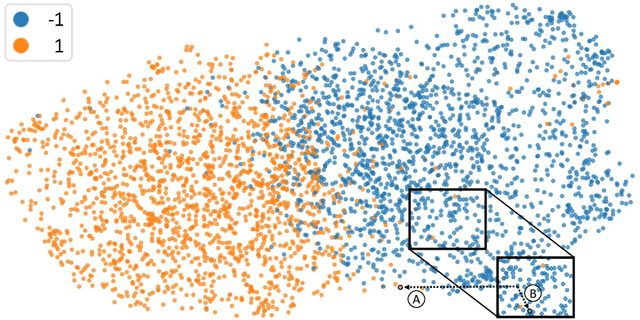


Abstract:Given the increasing amount and general complexity of time series data in domains such as finance, weather forecasting, and healthcare, there is a growing need for state-of-the-art performance models that can provide interpretable insights into underlying patterns and relationships. Attribution techniques enable the extraction of explanations from time series models to gain insights but are hard to evaluate for their robustness and trustworthiness. We propose the Attribution Stability Indicator (ASI), a measure to incorporate robustness and trustworthiness as properties of attribution techniques for time series into account. We extend a perturbation analysis with correlations of the original time series to the perturbed instance and the attributions to include wanted properties in the measure. We demonstrate the wanted properties based on an analysis of the attributions in a dimension-reduced space and the ASI scores distribution over three whole time series classification datasets.
 Add to Chrome
 Add to Firefox
 Add to Edge