Sinan Du
Learning to Pose Problems: Reasoning-Driven and Solver-Adaptive Data Synthesis for Large Reasoning Models
Nov 13, 2025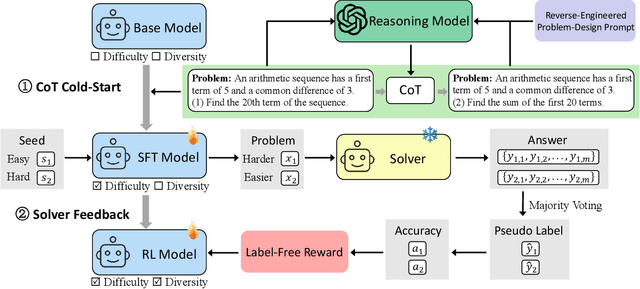
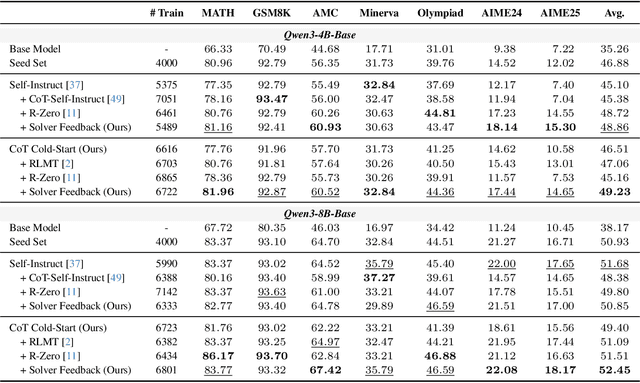
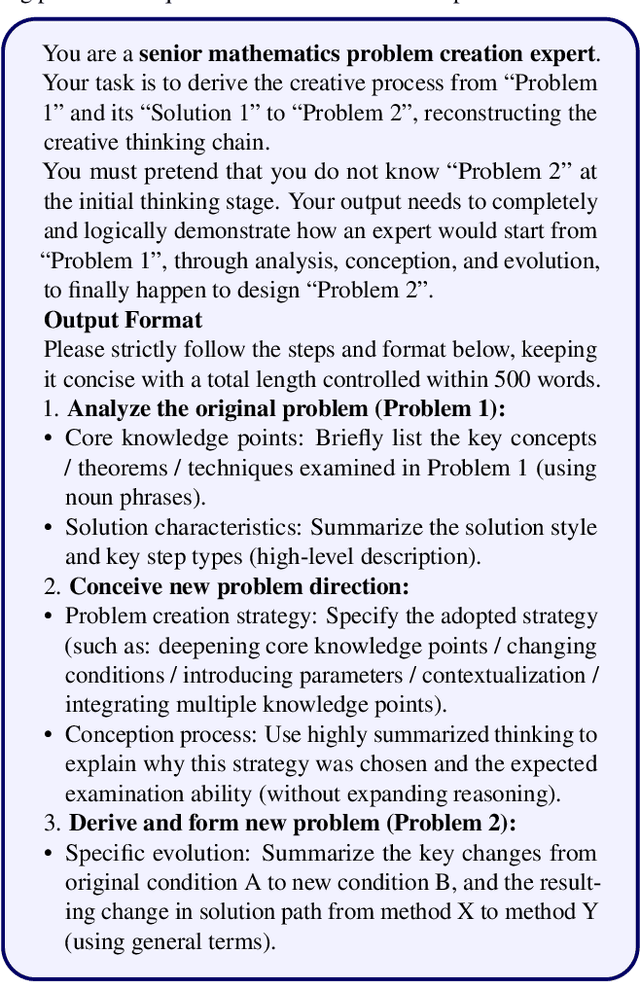
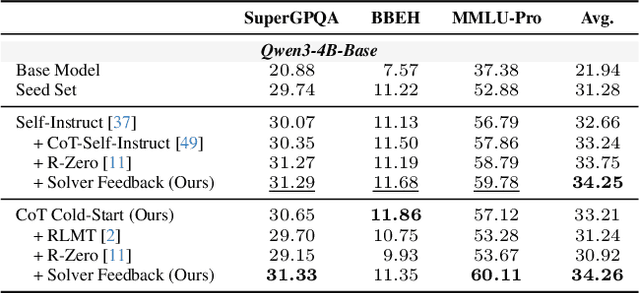
Abstract:Data synthesis for training large reasoning models offers a scalable alternative to limited, human-curated datasets, enabling the creation of high-quality data. However, existing approaches face several challenges: (i) indiscriminate generation that ignores the solver's ability and yields low-value problems, or reliance on complex data pipelines to balance problem difficulty; and (ii) a lack of reasoning in problem generation, leading to shallow problem variants. In this paper, we develop a problem generator that reasons explicitly to plan problem directions before synthesis and adapts difficulty to the solver's ability. Specifically, we construct related problem pairs and augment them with intermediate problem-design CoT produced by a reasoning model. These data bootstrap problem-design strategies from the generator. Then, we treat the solver's feedback on synthetic problems as a reward signal, enabling the generator to calibrate difficulty and produce complementary problems near the edge of the solver's competence. Extensive experiments on 10 mathematical and general reasoning benchmarks show that our method achieves an average improvement of 2.5% and generalizes to both language and vision-language models. Moreover, a solver trained on the synthesized data provides improved rewards for continued generator training, enabling co-evolution and yielding a further 0.7% performance gain. Our code will be made publicly available here.
Sample By Step, Optimize By Chunk: Chunk-Level GRPO For Text-to-Image Generation
Oct 24, 2025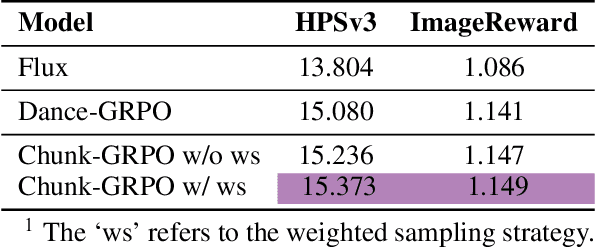
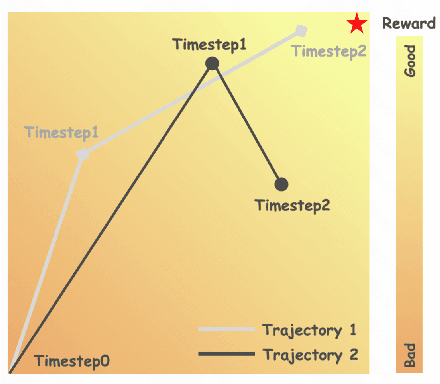


Abstract:Group Relative Policy Optimization (GRPO) has shown strong potential for flow-matching-based text-to-image (T2I) generation, but it faces two key limitations: inaccurate advantage attribution, and the neglect of temporal dynamics of generation. In this work, we argue that shifting the optimization paradigm from the step level to the chunk level can effectively alleviate these issues. Building on this idea, we propose Chunk-GRPO, the first chunk-level GRPO-based approach for T2I generation. The insight is to group consecutive steps into coherent 'chunk's that capture the intrinsic temporal dynamics of flow matching, and to optimize policies at the chunk level. In addition, we introduce an optional weighted sampling strategy to further enhance performance. Extensive experiments show that ChunkGRPO achieves superior results in both preference alignment and image quality, highlighting the promise of chunk-level optimization for GRPO-based methods.
Unifying Multimodal Large Language Model Capabilities and Modalities via Model Merging
May 26, 2025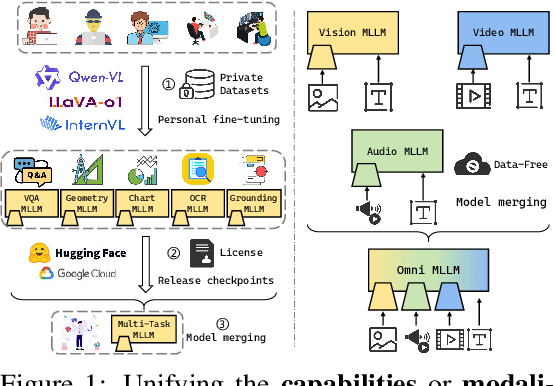

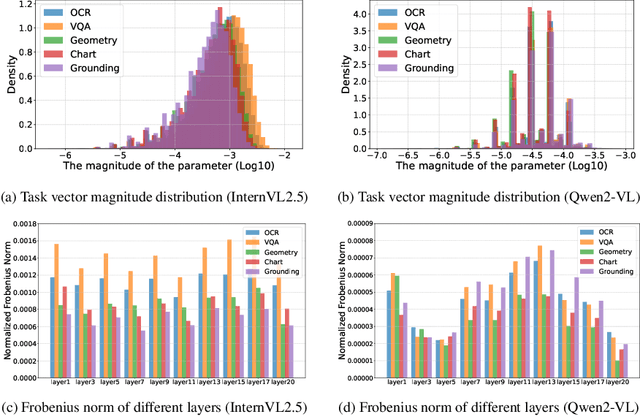
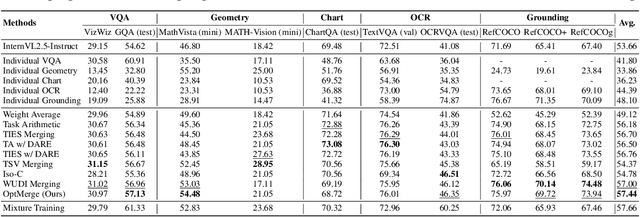
Abstract:While foundation models update slowly due to resource-intensive training requirements, domain-specific models evolve between updates. Model merging aims to combine multiple expert models into a single, more capable model, thereby reducing storage and serving costs while supporting decentralized model development. Despite its potential, previous studies have primarily focused on merging visual classification models or Large Language Models (LLMs) for code and math tasks. Multimodal Large Language Models (MLLMs), which extend the capabilities of LLMs through large-scale multimodal training, have gained traction. However, there lacks a benchmark for model merging research that clearly divides the tasks for MLLM training and evaluation. In this paper, (i) we introduce the model merging benchmark for MLLMs, which includes multiple tasks such as VQA, Geometry, Chart, OCR, and Grounding, providing both LoRA and full fine-tuning models. Moreover, we explore how model merging can combine different modalities (e.g., vision-language, audio-language, and video-language models), moving toward the Omni-language model. (ii) We implement 10 model merging algorithms on the benchmark. Furthermore, we propose a novel method that removes noise from task vectors and robustly optimizes the merged vector based on a loss defined over task vector interactions, achieving an average performance gain of 2.48%. (iii) We find that model merging offers a promising way for building improved MLLMs without requiring data training. Our results also demonstrate that the complementarity among multiple modalities outperforms individual modalities.
ALoRE: Efficient Visual Adaptation via Aggregating Low Rank Experts
Dec 11, 2024


Abstract:Parameter-efficient transfer learning (PETL) has become a promising paradigm for adapting large-scale vision foundation models to downstream tasks. Typical methods primarily leverage the intrinsic low rank property to make decomposition, learning task-specific weights while compressing parameter size. However, such approaches predominantly manipulate within the original feature space utilizing a single-branch structure, which might be suboptimal for decoupling the learned representations and patterns. In this paper, we propose ALoRE, a novel PETL method that reuses the hypercomplex parameterized space constructed by Kronecker product to Aggregate Low Rank Experts using a multi-branch paradigm, disentangling the learned cognitive patterns during training. Thanks to the artful design, ALoRE maintains negligible extra parameters and can be effortlessly merged into the frozen backbone via re-parameterization in a sequential manner, avoiding additional inference latency. We conduct extensive experiments on 24 image classification tasks using various backbone variants. Experimental results demonstrate that ALoRE outperforms the full fine-tuning strategy and other state-of-the-art PETL methods in terms of performance and parameter efficiency. For instance, ALoRE obtains 3.06% and 9.97% Top-1 accuracy improvement on average compared to full fine-tuning on the FGVC datasets and VTAB-1k benchmark by only updating 0.15M parameters.
ChartMoE: Mixture of Expert Connector for Advanced Chart Understanding
Sep 05, 2024


Abstract:Automatic chart understanding is crucial for content comprehension and document parsing. Multimodal large language models (MLLMs) have demonstrated remarkable capabilities in chart understanding through domain-specific alignment and fine-tuning. However, the application of alignment training within the chart domain is still underexplored. To address this, we propose ChartMoE, which employs the mixture of expert (MoE) architecture to replace the traditional linear projector to bridge the modality gap. Specifically, we train multiple linear connectors through distinct alignment tasks, which are utilized as the foundational initialization parameters for different experts. Additionally, we introduce ChartMoE-Align, a dataset with over 900K chart-table-JSON-code quadruples to conduct three alignment tasks (chart-table/JSON/code). Combined with the vanilla connector, we initialize different experts in four distinct ways and adopt high-quality knowledge learning to further refine the MoE connector and LLM parameters. Extensive experiments demonstrate the effectiveness of the MoE connector and our initialization strategy, e.g., ChartMoE improves the accuracy of the previous state-of-the-art from 80.48% to 84.64% on the ChartQA benchmark.
ChartBench: A Benchmark for Complex Visual Reasoning in Charts
Dec 26, 2023Abstract:Multimodal Large Language Models (MLLMs) have demonstrated remarkable multimodal understanding and generation capabilities. However, their understanding of synthetic charts is limited, while existing benchmarks are simplistic and the charts deviate significantly from real-world examples, making it challenging to accurately assess MLLMs' chart comprehension abilities. Hence, a challenging benchmark is essential for investigating progress and uncovering the limitations of current MLLMs on chart data. In this work, we propose to examine chart comprehension through more complex visual logic and introduce ChartBench, a comprehensive chart benchmark to accurately measure MLLMs' fundamental chart comprehension and data reliability. Specifically, ChartBench consists of \textbf{41} categories, \textbf{2K} charts, and \textbf{16K} QA annotations. While significantly expanding chart types, ChartBench avoids direct labelling of data points, which requires MLLMs to infer values akin to humans by leveraging elements like color, legends, and coordinate systems. We also introduce an improved metric, \textit{Acc+}, which accurately reflects MLLMs' chart comprehension abilities while avoiding labor-intensive manual evaluations or costly GPT-based evaluations. We conduct evaluations on \textbf{12} mainstream open-source models and \textbf{2} outstanding proprietary models. Through extensive experiments, we reveal the limitations of MLLMs on charts and provide insights to inspire the community to pay closer attention to MLLMs' chart comprehension abilities. The benchmark and code will be publicly available for research.
 Add to Chrome
 Add to Firefox
 Add to Edge