 Add to Chrome
 Add to Firefox
 Add to Edge
MSAD: A Deep Dive into Model Selection for Time series Anomaly Detection
Oct 30, 2025Anomaly detection is a fundamental task for time series analytics with important implications for the downstream performance of many applications. Despite increasing academic interest and the large number of methods proposed in the literature, recent benchmarks and evaluation studies demonstrated that no overall best anomaly detection methods exist when applied to very heterogeneous time series datasets. Therefore, the only scalable and viable solution to solve anomaly detection over very different time series collected from diverse domains is to propose a model selection method that will select, based on time series characteristics, the best anomaly detection methods to run. Existing AutoML solutions are, unfortunately, not directly applicable to time series anomaly detection, and no evaluation of time series-based approaches for model selection exists. Towards that direction, this paper studies the performance of time series classification methods used as model selection for anomaly detection. In total, we evaluate 234 model configurations derived from 16 base classifiers across more than 1980 time series, and we propose the first extensive experimental evaluation of time series classification as model selection for anomaly detection. Our results demonstrate that model selection methods outperform every single anomaly detection method while being in the same order of magnitude regarding execution time. This evaluation is the first step to demonstrate the accuracy and efficiency of time series classification algorithms for anomaly detection, and represents a strong baseline that can then be used to guide the model selection step in general AutoML pipelines. Preprint version of an article accepted at the VLDB Journal.
* 25 pages, 13 figures, VLDB Journal
DeviceScope: An Interactive App to Detect and Localize Appliance Patterns in Electricity Consumption Time Series
Jun 06, 2025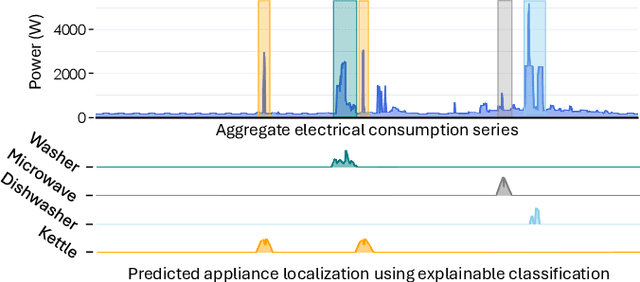
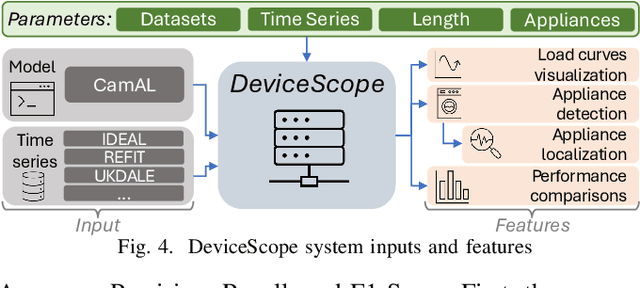
In recent years, electricity suppliers have installed millions of smart meters worldwide to improve the management of the smart grid system. These meters collect a large amount of electrical consumption data to produce valuable information to help consumers reduce their electricity footprint. However, having non-expert users (e.g., consumers or sales advisors) understand these data and derive usage patterns for different appliances has become a significant challenge for electricity suppliers because these data record the aggregated behavior of all appliances. At the same time, ground-truth labels (which could train appliance detection and localization models) are expensive to collect and extremely scarce in practice. This paper introduces DeviceScope, an interactive tool designed to facilitate understanding smart meter data by detecting and localizing individual appliance patterns within a given time period. Our system is based on CamAL (Class Activation Map-based Appliance Localization), a novel weakly supervised approach for appliance localization that only requires the knowledge of the existence of an appliance in a household to be trained. This paper appeared in ICDE 2025.
* 4 pages, 5 figures. This paper appeared in ICDE 2025
Few Labels are all you need: A Weakly Supervised Framework for Appliance Localization in Smart-Meter Series
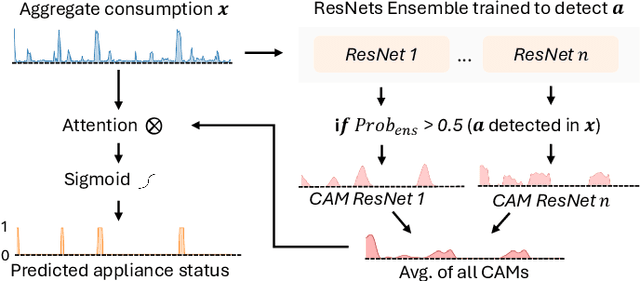
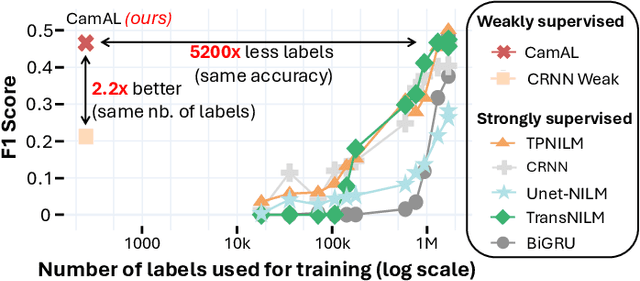
Jun 06, 2025Improving smart grid system management is crucial in the fight against climate change, and enabling consumers to play an active role in this effort is a significant challenge for electricity suppliers. In this regard, millions of smart meters have been deployed worldwide in the last decade, recording the main electricity power consumed in individual households. This data produces valuable information that can help them reduce their electricity footprint; nevertheless, the collected signal aggregates the consumption of the different appliances running simultaneously in the house, making it difficult to apprehend. Non-Intrusive Load Monitoring (NILM) refers to the challenge of estimating the power consumption, pattern, or on/off state activation of individual appliances using the main smart meter signal. Recent methods proposed to tackle this task are based on a fully supervised deep-learning approach that requires both the aggregate signal and the ground truth of individual appliance power. However, such labels are expensive to collect and extremely scarce in practice, as they require conducting intrusive surveys in households to monitor each appliance. In this paper, we introduce CamAL, a weakly supervised approach for appliance pattern localization that only requires information on the presence of an appliance in a household to be trained. CamAL merges an ensemble of deep-learning classifiers combined with an explainable classification method to be able to localize appliance patterns. Our experimental evaluation, conducted on 4 real-world datasets, demonstrates that CamAL significantly outperforms existing weakly supervised baselines and that current SotA fully supervised NILM approaches require significantly more labels to reach CamAL performances. The source of our experiments is available at: https://github.com/adrienpetralia/CamAL. This paper appeared in ICDE 2025.
* 12 pages, 10 figures. This paper appeared in IEEE ICDE 2025
Graphint: Graph-based Time Series Clustering Visualisation Tool
Mar 10, 2025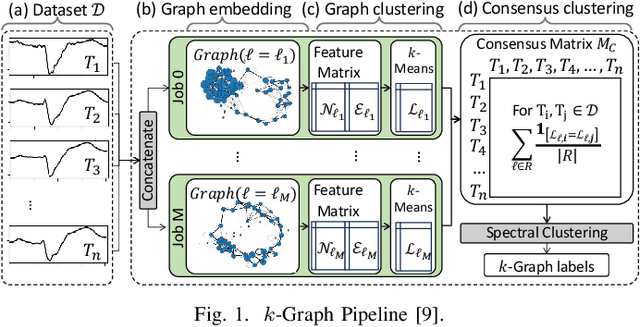
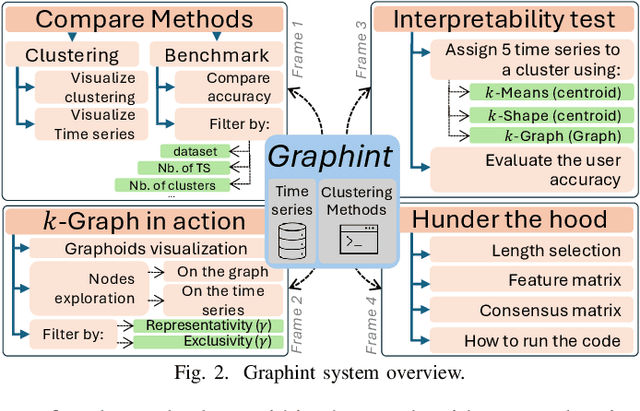
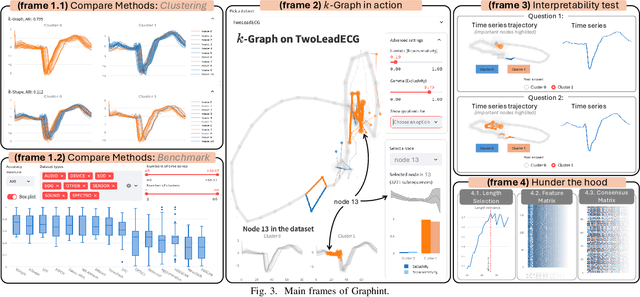
With the exponential growth of time series data across diverse domains, there is a pressing need for effective analysis tools. Time series clustering is important for identifying patterns in these datasets. However, prevailing methods often encounter obstacles in maintaining data relationships and ensuring interpretability. We present Graphint, an innovative system based on the $k$-Graph methodology that addresses these challenges. Graphint integrates a robust time series clustering algorithm with an interactive tool for comparison and interpretation. More precisely, our system allows users to compare results against competing approaches, identify discriminative subsequences within specified datasets, and visualize the critical information utilized by $k$-Graph to generate outputs. Overall, Graphint offers a comprehensive solution for extracting actionable insights from complex temporal datasets.
$k$-Graph: A Graph Embedding for Interpretable Time Series Clustering
Feb 18, 2025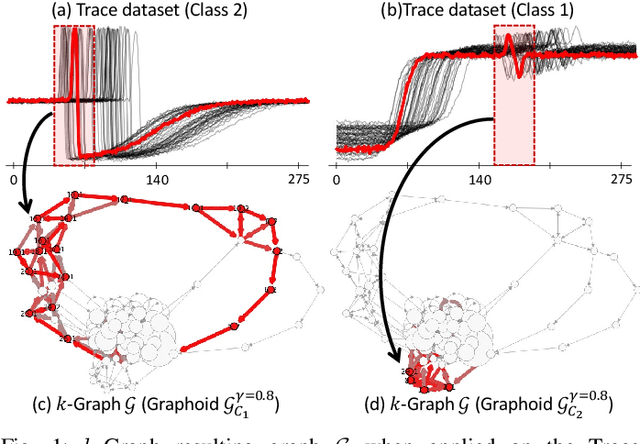


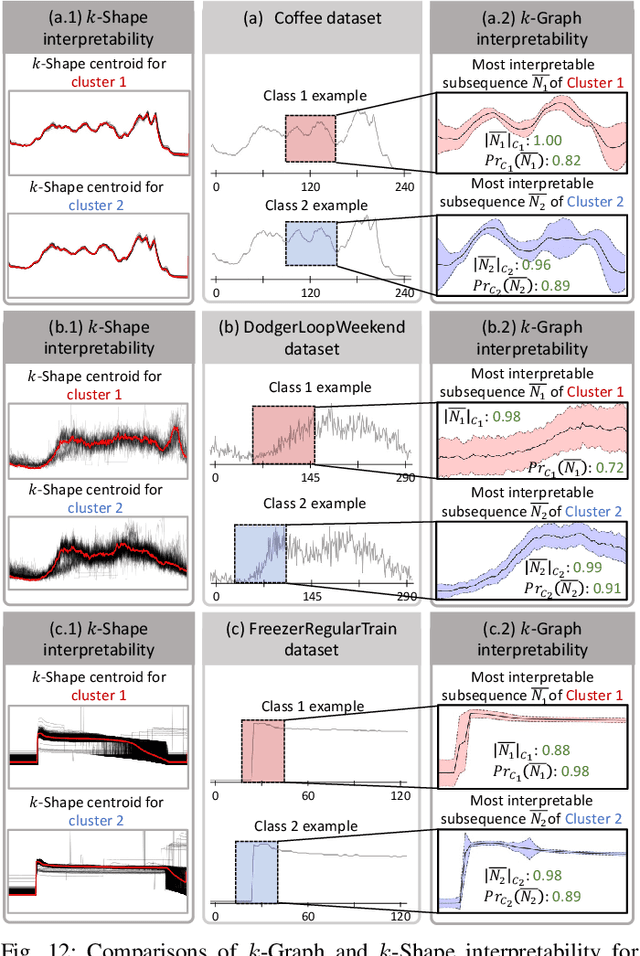
Time series clustering poses a significant challenge with diverse applications across domains. A prominent drawback of existing solutions lies in their limited interpretability, often confined to presenting users with centroids. In addressing this gap, our work presents $k$-Graph, an unsupervised method explicitly crafted to augment interpretability in time series clustering. Leveraging a graph representation of time series subsequences, $k$-Graph constructs multiple graph representations based on different subsequence lengths. This feature accommodates variable-length time series without requiring users to predetermine subsequence lengths. Our experimental results reveal that $k$-Graph outperforms current state-of-the-art time series clustering algorithms in accuracy, while providing users with meaningful explanations and interpretations of the clustering outcomes.
VUS: Effective and Efficient Accuracy Measures for Time-Series Anomaly Detection
Feb 18, 2025


Anomaly detection (AD) is a fundamental task for time-series analytics with important implications for the downstream performance of many applications. In contrast to other domains where AD mainly focuses on point-based anomalies (i.e., outliers in standalone observations), AD for time series is also concerned with range-based anomalies (i.e., outliers spanning multiple observations). Nevertheless, it is common to use traditional point-based information retrieval measures, such as Precision, Recall, and F-score, to assess the quality of methods by thresholding the anomaly score to mark each point as an anomaly or not. However, mapping discrete labels into continuous data introduces unavoidable shortcomings, complicating the evaluation of range-based anomalies. Notably, the choice of evaluation measure may significantly bias the experimental outcome. Despite over six decades of attention, there has never been a large-scale systematic quantitative and qualitative analysis of time-series AD evaluation measures. This paper extensively evaluates quality measures for time-series AD to assess their robustness under noise, misalignments, and different anomaly cardinality ratios. Our results indicate that measures producing quality values independently of a threshold (i.e., AUC-ROC and AUC-PR) are more suitable for time-series AD. Motivated by this observation, we first extend the AUC-based measures to account for range-based anomalies. Then, we introduce a new family of parameter-free and threshold-independent measures, Volume Under the Surface (VUS), to evaluate methods while varying parameters. We also introduce two optimized implementations for VUS that reduce significantly the execution time of the initial implementation. Our findings demonstrate that our four measures are significantly more robust in assessing the quality of time-series AD methods.
Dive into Time-Series Anomaly Detection: A Decade Review
Dec 29, 2024Recent advances in data collection technology, accompanied by the ever-rising volume and velocity of streaming data, underscore the vital need for time series analytics. In this regard, time-series anomaly detection has been an important activity, entailing various applications in fields such as cyber security, financial markets, law enforcement, and health care. While traditional literature on anomaly detection is centered on statistical measures, the increasing number of machine learning algorithms in recent years call for a structured, general characterization of the research methods for time-series anomaly detection. This survey groups and summarizes anomaly detection existing solutions under a process-centric taxonomy in the time series context. In addition to giving an original categorization of anomaly detection methods, we also perform a meta-analysis of the literature and outline general trends in time-series anomaly detection research.
Appliance Detection Using Very Low-Frequency Smart Meter Time Series
May 21, 2023


In recent years, smart meters have been widely adopted by electricity suppliers to improve the management of the smart grid system. These meters usually collect energy consumption data at a very low frequency (every 30min), enabling utilities to bill customers more accurately. To provide more personalized recommendations, the next step is to detect the appliances owned by customers, which is a challenging problem, due to the very-low meter reading frequency. Even though the appliance detection problem can be cast as a time series classification problem, with many such classifiers having been proposed in the literature, no study has applied and compared them on this specific problem. This paper presents an in-depth evaluation and comparison of state-of-the-art time series classifiers applied to detecting the presence/absence of diverse appliances in very low-frequency smart meter data. We report results with five real datasets. We first study the impact of the detection quality of 13 different appliances using 30min sampled data, and we subsequently propose an analysis of the possible detection performance gain by using a higher meter reading frequency. The results indicate that the performance of current time series classifiers varies significantly. Some of them, namely deep learning-based classifiers, provide promising results in terms of accuracy (especially for certain appliances), even using 30min sampled data, and are scalable to the large smart meter time series collections of energy consumption data currently available to electricity suppliers. Nevertheless, our study shows that more work is needed in this area to further improve the accuracy of the proposed solutions. This paper appeared in ACM e-Energy 2023.
Series2Graph: Graph-based Subsequence Anomaly Detection for Time Series
Jul 25, 2022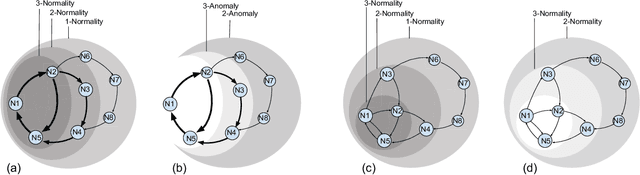
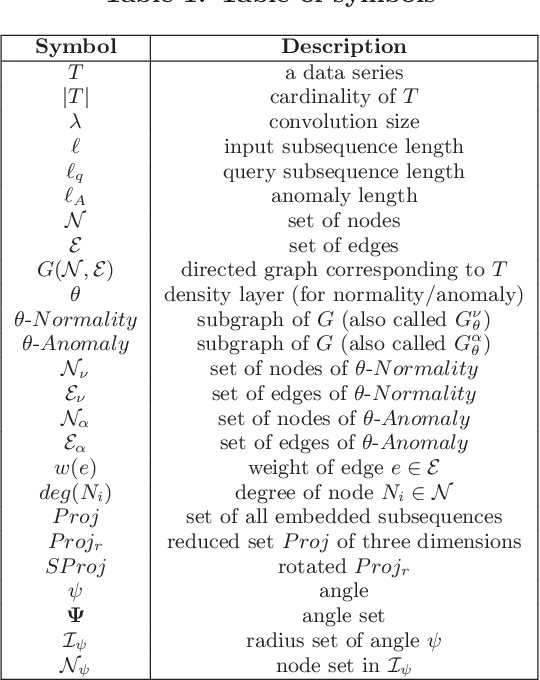

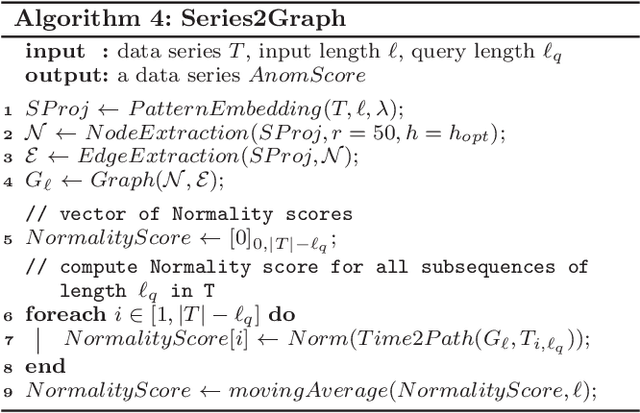
Subsequence anomaly detection in long sequences is an important problem with applications in a wide range of domains. However, the approaches proposed so far in the literature have severe limitations: they either require prior domain knowledge used to design the anomaly discovery algorithms, or become cumbersome and expensive to use in situations with recurrent anomalies of the same type. In this work, we address these problems, and propose an unsupervised method suitable for domain agnostic subsequence anomaly detection. Our method, Series2Graph, is based on a graph representation of a novel low-dimensionality embedding of subsequences. Series2Graph needs neither labeled instances (like supervised techniques) nor anomaly-free data (like zero-positive learning techniques), and identifies anomalies of varying lengths. The experimental results, on the largest set of synthetic and real datasets used to date, demonstrate that the proposed approach correctly identifies single and recurrent anomalies without any prior knowledge of their characteristics, outperforming by a large margin several competing approaches in accuracy, while being up to orders of magnitude faster. This paper has appeared in VLDB 2020.
dCAM: Dimension-wise Class Activation Map for Explaining Multivariate Data Series Classification
Jul 25, 2022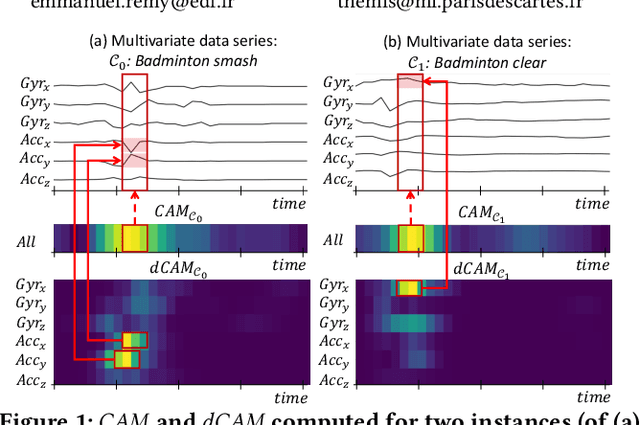
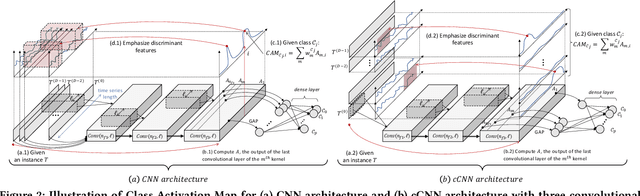
Data series classification is an important and challenging problem in data science. Explaining the classification decisions by finding the discriminant parts of the input that led the algorithm to some decisions is a real need in many applications. Convolutional neural networks perform well for the data series classification task; though, the explanations provided by this type of algorithm are poor for the specific case of multivariate data series. Addressing this important limitation is a significant challenge. In this paper, we propose a novel method that solves this problem by highlighting both the temporal and dimensional discriminant information. Our contribution is two-fold: we first describe a convolutional architecture that enables the comparison of dimensions; then, we propose a method that returns dCAM, a Dimension-wise Class Activation Map specifically designed for multivariate time series (and CNN-based models). Experiments with several synthetic and real datasets demonstrate that dCAM is not only more accurate than previous approaches, but the only viable solution for discriminant feature discovery and classification explanation in multivariate time series. This paper has appeared in SIGMOD'22.