Eric K. Tokuda
Sidewalk Measurements from Satellite Images: Preliminary Findings
Dec 12, 2021


Abstract:Large-scale analysis of pedestrian infrastructures, particularly sidewalks, is critical to human-centric urban planning and design. Benefiting from the rich data set of planimetric features and high-resolution orthoimages provided through the New York City Open Data portal, we train a computer vision model to detect sidewalks, roads, and buildings from remote-sensing imagery and achieve 83% mIoU over held-out test set. We apply shape analysis techniques to study different attributes of the extracted sidewalks. More specifically, we do a tile-wise analysis of the width, angle, and curvature of sidewalks, which aside from their general impacts on walkability and accessibility of urban areas, are known to have significant roles in the mobility of wheelchair users. The preliminary results are promising, glimpsing the potential of the proposed approach to be adopted in different cities, enabling researchers and practitioners to have a more vivid picture of the pedestrian realm.
Unraveling the graph structure of tabular datasets through Bayesian and spectral analysis
Oct 04, 2021


Abstract:In the big-data age tabular datasets are being generated and analyzed everywhere. As a consequence, finding and understanding the relationships between the features of these datasets are of great relevance. Here, to encompass these relationships we propose a methodology that maps an entire tabular dataset or just an observation into a weighted directed graph using the Shapley additive explanations technique. With this graph of relationships, we show that the inference of the hierarchical modular structure obtained by the nested stochastic block model (nSBM) as well as the study of the spectral space of the magnetic Laplacian can help us identify the classes of features and unravel non-trivial relationships. As a case study, we analyzed a socioeconomic survey conducted with students in Brazil: the PeNSE survey. The spectral embedding of the columns suggested that questions related to physical activities form a separate group. The application of the nSBM approach, corroborated with that and allowed complementary findings about the modular structure: some groups of questions showed a high adherence with the divisions qualitatively defined by the designers of the survey. However, questions from the class \textit{Safety} were partly grouped by our method in the class \textit{Drugs}. Surprisingly, by inspecting these questions, we observed that they were related to both these topics, suggesting an alternative interpretation of these questions. Our method can provide guidance for tabular data analysis as well as the design of future surveys.
Revisiting Agglomerative Clustering
May 16, 2020


Abstract:In data clustering, emphasis is often placed in finding groups of points. An equally important subject concerns the avoidance of false positives. As it could be expected, these two goals oppose one another, in the sense that emphasis on finding clusters tends to imply in higher probability of obtaining false positives. The present work addresses this problem considering some traditional agglomerative methods, namely single, average, median, complete, centroid and Ward's applied to unimodal and bimodal datasets following uniform, gaussian, exponential and power-law distributions. More importantly, we adopt a generic model of clusters involving a higher density core surrounded by a transition zone, followed by a sparser set of outliers. Combined with preliminary specification of the size of the expected clusters, this model paved the way to the implementation of an objective means for identifying the clusters from dendrograms. In addition, the adopted model also allowed the relevance of the detected clusters to be estimated in terms of the height of the subtrees corresponding to the identified clusters. More specifically, the lower this height, the more compact and relevant the clusters tend to be. Several interesting results have been obtained, including the tendency of several of the considered methods to detect two clusters in unimodal data. The single-linkage method has been found to provide the best resilience to this tendency. In addition, several methods tended to detect clusters that do not correspond directly to the cores, therefore characterized by lower relevance. The possibility of identifying the type of distribution of points from the adopted measurements was also investigated.
Quantifying the presence of graffiti in urban environments
Apr 08, 2019


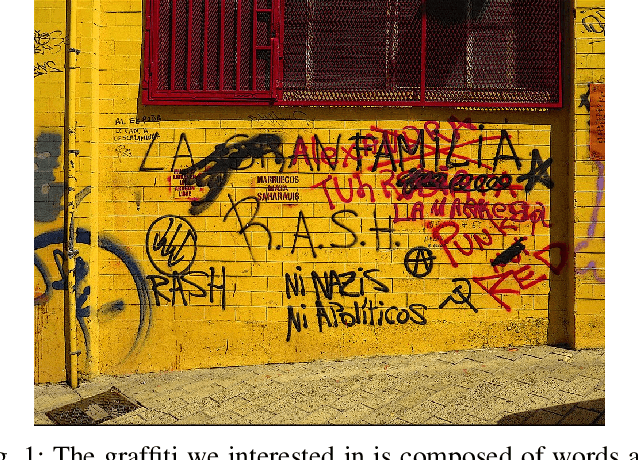
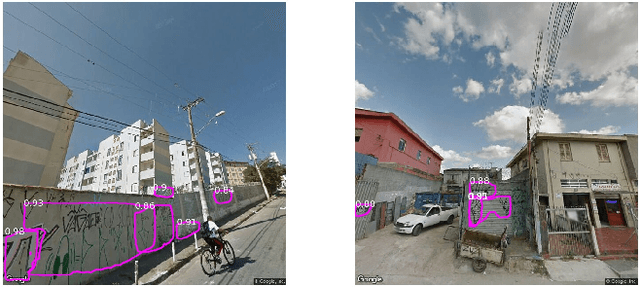
Abstract:Graffiti is a common phenomenon in urban scenarios. Differently from urban art, graffiti tagging is a vandalism act and many local governments are putting great effort to combat it. The graffiti map of a region can be a very useful resource because it may allow one to potentially combat vandalism in locations with high level of graffiti and also to cleanup saturated regions to discourage future acts. There is currently no automatic way of obtaining a graffiti map of a region and it is obtained by manual inspection by the police or by popular participation. In this sense, we describe an ongoing work where we propose an automatic way of obtaining a graffiti map of a neighbourhood. It consists of the systematic collection of street view images followed by the identification of graffiti tags in the collected dataset and finally, in the calculation of the proposed graffiti level of that location. We validate the proposed method by evaluating the geographical distribution of graffiti in a city known to have high concentration of graffiti -- Sao Paulo, Brazil.
Single Image Deraining: A Comprehensive Benchmark Analysis
Mar 20, 2019


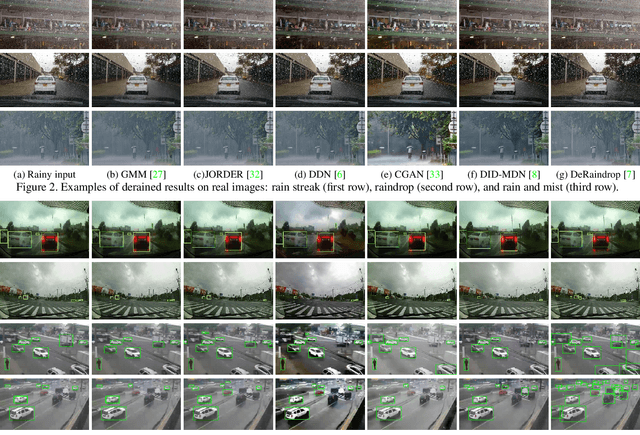
Abstract:We present a comprehensive study and evaluation of existing single image deraining algorithms, using a new large-scale benchmark consisting of both synthetic and real-world rainy images.This dataset highlights diverse data sources and image contents, and is divided into three subsets (rain streak, rain drop, rain and mist), each serving different training or evaluation purposes. We further provide a rich variety of criteria for dehazing algorithm evaluation, ranging from full-reference metrics, to no-reference metrics, to subjective evaluation and the novel task-driven evaluation. Experiments on the dataset shed light on the comparisons and limitations of state-of-the-art deraining algorithms, and suggest promising future directions.
A new approach for pedestrian density estimation using moving sensors and computer vision
Nov 12, 2018


Abstract:An understanding of pedestrians dynamics is indispensable for numerous urban applications including the design of transportation networks and planing for business development. Pedestrian counting often requires utilizing manual or technical means to count individual pedestrians in each location of interest. However, such methods do not scale to the size of a city and a new approach to fill this gap is here proposed. In this project, we used a large dense dataset of images of New York City along with deep learning and computer vision techniques to construct a spatio-temporal map of relative pedestrian density. Due to the limitations of state of the art computer vision methods, such automatic detection of pedestrians is inherently subject to errors. We model these errors as a probabilistic process, for which we provide theoretical analysis and through numerical simulations. We demonstrate that, within our assumptions, our methodology can supply a reasonable estimate of pedestrian densities and provide theoretical bounds for the resulting error.
Identificação automática de pichação a partir de imagens urbanas
Nov 06, 2018Abstract:Graffiti tagging is a common issue in great cities an local authorities are on the move to combat it. The tagging map of a city can be a useful tool as it may help to clean-up highly saturated regions and discourage future acts in the neighbourhood and currently there is no way of getting a tagging map of a region in an automatic fashion and manual inspection or crowd participation are required. In this work, we describe a work in progress in creating an automatic way to get a tagging map of a city or region. It is based on the use of street view images and on the detection of graffiti tags in the images.
 Add to Chrome
 Add to Firefox
 Add to Edge