Ashley Suh
Don't Just Translate, Agitate: Using Large Language Models as Devil's Advocates for AI Explanations
Apr 16, 2025Abstract:This position paper highlights a growing trend in Explainable AI (XAI) research where Large Language Models (LLMs) are used to translate outputs from explainability techniques, like feature-attribution weights, into a natural language explanation. While this approach may improve accessibility or readability for users, recent findings suggest that translating into human-like explanations does not necessarily enhance user understanding and may instead lead to overreliance on AI systems. When LLMs summarize XAI outputs without surfacing model limitations, uncertainties, or inconsistencies, they risk reinforcing the illusion of interpretability rather than fostering meaningful transparency. We argue that - instead of merely translating XAI outputs - LLMs should serve as constructive agitators, or devil's advocates, whose role is to actively interrogate AI explanations by presenting alternative interpretations, potential biases, training data limitations, and cases where the model's reasoning may break down. In this role, LLMs can facilitate users in engaging critically with AI systems and generated explanations, with the potential to reduce overreliance caused by misinterpreted or specious explanations.
Mitigating LLM Hallucinations with Knowledge Graphs: A Case Study
Apr 16, 2025Abstract:High-stakes domains like cyber operations need responsible and trustworthy AI methods. While large language models (LLMs) are becoming increasingly popular in these domains, they still suffer from hallucinations. This research paper provides learning outcomes from a case study with LinkQ, an open-source natural language interface that was developed to combat hallucinations by forcing an LLM to query a knowledge graph (KG) for ground-truth data during question-answering (QA). We conduct a quantitative evaluation of LinkQ using a well-known KGQA dataset, showing that the system outperforms GPT-4 but still struggles with certain question categories - suggesting that alternative query construction strategies will need to be investigated in future LLM querying systems. We discuss a qualitative study of LinkQ with two domain experts using a real-world cybersecurity KG, outlining these experts' feedback, suggestions, perceived limitations, and future opportunities for systems like LinkQ.
More Questions than Answers? Lessons from Integrating Explainable AI into a Cyber-AI Tool
Aug 08, 2024
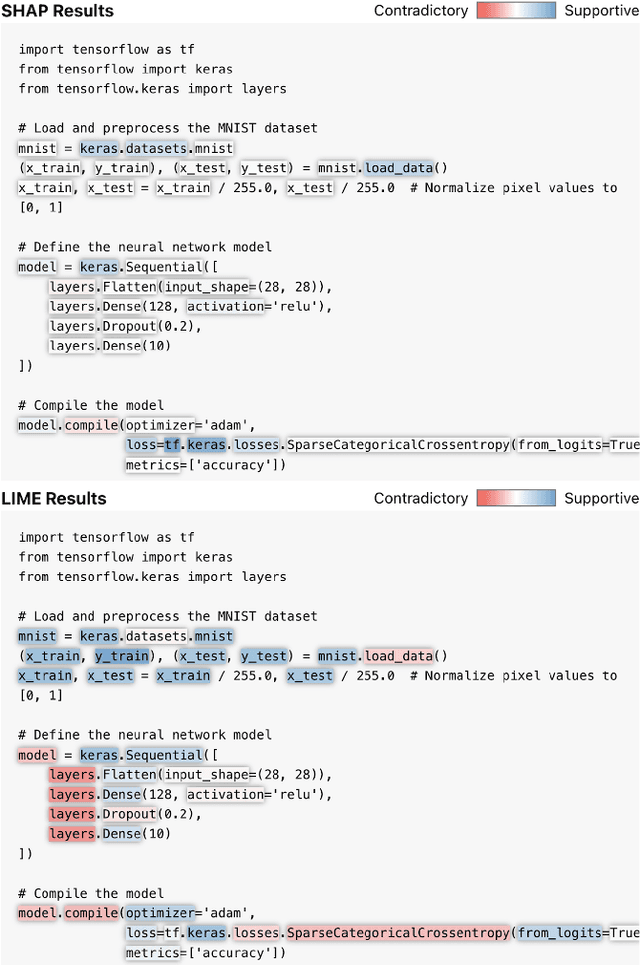
Abstract:We share observations and challenges from an ongoing effort to implement Explainable AI (XAI) in a domain-specific workflow for cybersecurity analysts. Specifically, we briefly describe a preliminary case study on the use of XAI for source code classification, where accurate assessment and timeliness are paramount. We find that the outputs of state-of-the-art saliency explanation techniques (e.g., SHAP or LIME) are lost in translation when interpreted by people with little AI expertise, despite these techniques being marketed for non-technical users. Moreover, we find that popular XAI techniques offer fewer insights for real-time human-AI workflows when they are post hoc and too localized in their explanations. Instead, we observe that cyber analysts need higher-level, easy-to-digest explanations that can offer as little disruption as possible to their workflows. We outline unaddressed gaps in practical and effective XAI, then touch on how emerging technologies like Large Language Models (LLMs) could mitigate these existing obstacles.
LinkQ: An LLM-Assisted Visual Interface for Knowledge Graph Question-Answering
Jun 07, 2024Abstract:We present LinkQ, a system that leverages a large language model (LLM) to facilitate knowledge graph (KG) query construction through natural language question-answering. Traditional approaches often require detailed knowledge of complex graph querying languages, limiting the ability for users -- even experts -- to acquire valuable insights from KG data. LinkQ simplifies this process by first interpreting a user's question, then converting it into a well-formed KG query. By using the LLM to construct a query instead of directly answering the user's question, LinkQ guards against the LLM hallucinating or generating false, erroneous information. By integrating an LLM into LinkQ, users are able to conduct both exploratory and confirmatory data analysis, with the LLM helping to iteratively refine open-ended questions into precise ones. To demonstrate the efficacy of LinkQ, we conducted a qualitative study with five KG practitioners and distill their feedback. Our results indicate that practitioners find LinkQ effective for KG question-answering, and desire future LLM-assisted systems for the exploratory analysis of graph databases.
Visual Validation versus Visual Estimation: A Study on the Average Value in Scatterplots
Jul 18, 2023


Abstract:We investigate the ability of individuals to visually validate statistical models in terms of their fit to the data. While visual model estimation has been studied extensively, visual model validation remains under-investigated. It is unknown how well people are able to visually validate models, and how their performance compares to visual and computational estimation. As a starting point, we conducted a study across two populations (crowdsourced and volunteers). Participants had to both visually estimate (i.e, draw) and visually validate (i.e., accept or reject) the frequently studied model of averages. Across both populations, the level of accuracy of the models that were considered valid was lower than the accuracy of the estimated models. We find that participants' validation and estimation were unbiased. Moreover, their natural critical point between accepting and rejecting a given mean value is close to the boundary of its 95% confidence interval, indicating that the visually perceived confidence interval corresponds to a common statistical standard. Our work contributes to the understanding of visual model validation and opens new research opportunities.
Characterizing the Users, Challenges, and Visualization Needs of Knowledge Graphs in Practice
Apr 06, 2023


Abstract:This study presents insights from interviews with nineteen Knowledge Graph (KG) practitioners who work in both enterprise and academic settings on a wide variety of use cases. Through this study, we identify critical challenges experienced by KG practitioners when creating, exploring, and analyzing KGs that could be alleviated through visualization design. Our findings reveal three major personas among KG practitioners - KG Builders, Analysts, and Consumers - each of whom have their own distinct expertise and needs. We discover that KG Builders would benefit from schema enforcers, while KG Analysts need customizable query builders that provide interim query results. For KG Consumers, we identify a lack of efficacy for node-link diagrams, and the need for tailored domain-specific visualizations to promote KG adoption and comprehension. Lastly, we find that implementing KGs effectively in practice requires both technical and social solutions that are not addressed with current tools, technologies, and collaborative workflows. From the analysis of our interviews, we distill several visualization research directions to improve KG usability, including knowledge cards that balance digestibility and discoverability, timeline views to track temporal changes, interfaces that support organic discovery, and semantic explanations for AI and machine learning predictions.
Visualization Guidelines for Model Performance Communication Between Data Scientists and Subject Matter Experts
May 11, 2022
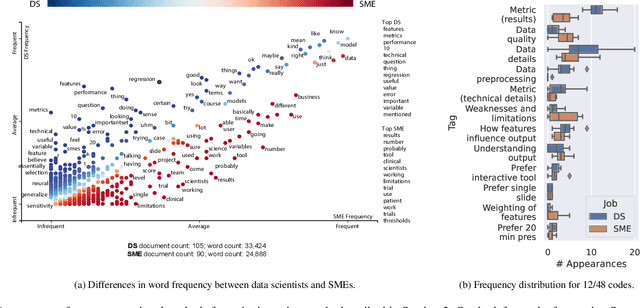


Abstract:Presenting the complexities of a model's performance is a communication bottleneck that threatens collaborations between data scientists and subject matter experts. Accuracy and error metrics alone fail to tell the whole story of a model - its risks, strengths, and limitations - making it difficult for subject matter experts to feel confident in deciding to use a model. As a result, models may fail in unexpected ways if their weaknesses are not clearly understood. Alternatively, models may go unused, as subject matter experts disregard poorly presented models in favor of familiar, yet arguably substandard methods. In this paper, we propose effective use of visualization as a medium for communication between data scientists and subject matter experts. Our research addresses the gap between common practices in model performance communication and the understanding of subject matter experts and decision makers. We derive a set of communication guidelines and recommended visualizations for communicating model performance based on interviews of both data scientists and subject matter experts at the same organization. We conduct a follow-up study with subject matter experts to evaluate the efficacy of our guidelines in presentations of model performance with and without our recommendations. We find that our proposed guidelines made subject matter experts more aware of the tradeoffs of the presented model. Participants realized that current communication methods left them without a robust understanding of the model's performance, potentially giving them misplaced confidence in the use of the model.
UnProjection: Leveraging Inverse-Projections for Visual Analytics of High-Dimensional Data
Nov 02, 2021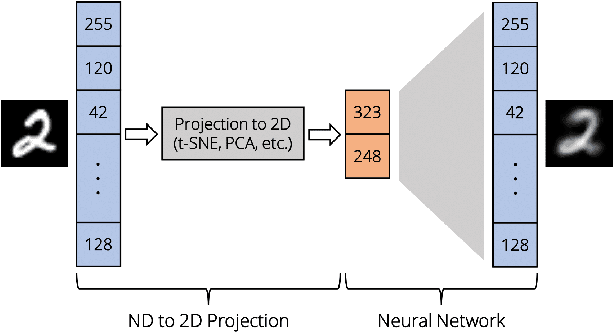
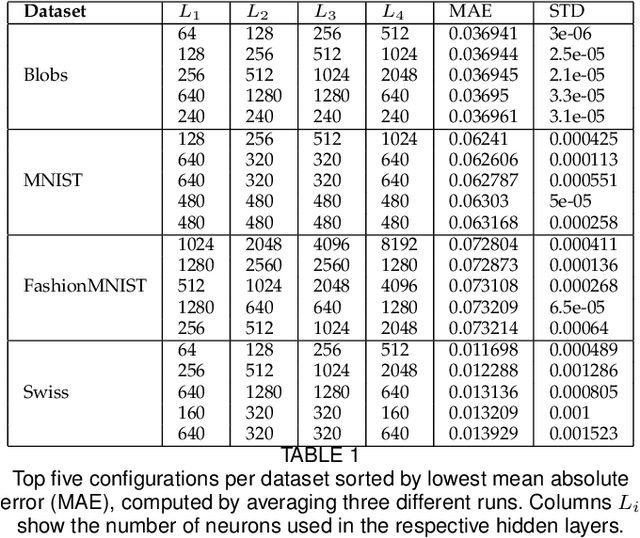

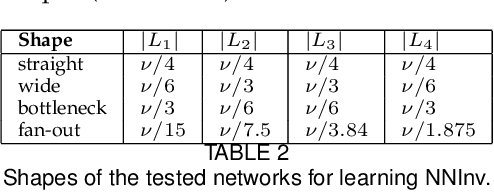
Abstract:Projection techniques are often used to visualize high-dimensional data, allowing users to better understand the overall structure of multi-dimensional spaces on a 2D screen. Although many such methods exist, comparably little work has been done on generalizable methods of inverse-projection -- the process of mapping the projected points, or more generally, the projection space back to the original high-dimensional space. In this paper we present NNInv, a deep learning technique with the ability to approximate the inverse of any projection or mapping. NNInv learns to reconstruct high-dimensional data from any arbitrary point on a 2D projection space, giving users the ability to interact with the learned high-dimensional representation in a visual analytics system. We provide an analysis of the parameter space of NNInv, and offer guidance in selecting these parameters. We extend validation of the effectiveness of NNInv through a series of quantitative and qualitative analyses. We then demonstrate the method's utility by applying it to three visualization tasks: interactive instance interpolation, classifier agreement, and gradient visualization.
 Add to Chrome
 Add to Firefox
 Add to Edge