Abishek Balachandran
Automated detection and quantification of COVID-19 airspace disease on chest radiographs: A novel approach achieving radiologist-level performance using a CNN trained on digital reconstructed radiographs (DRRs) from CT-based ground-truth
Aug 13, 2020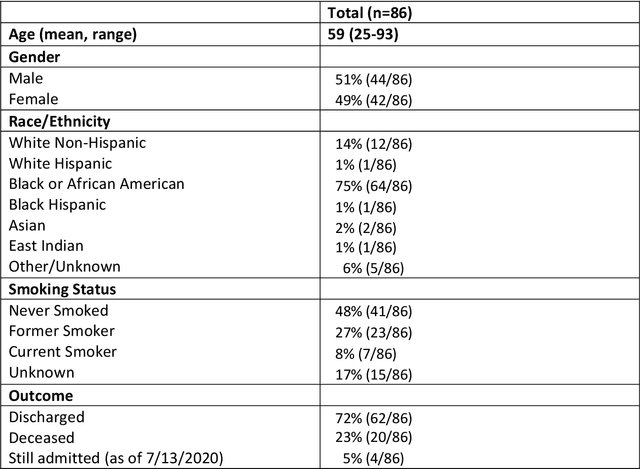
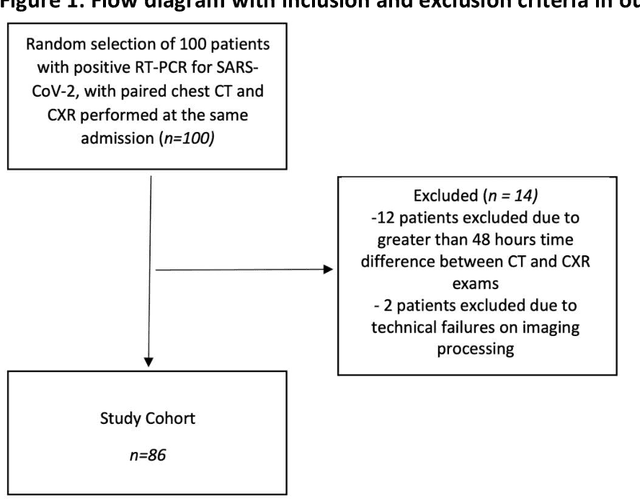

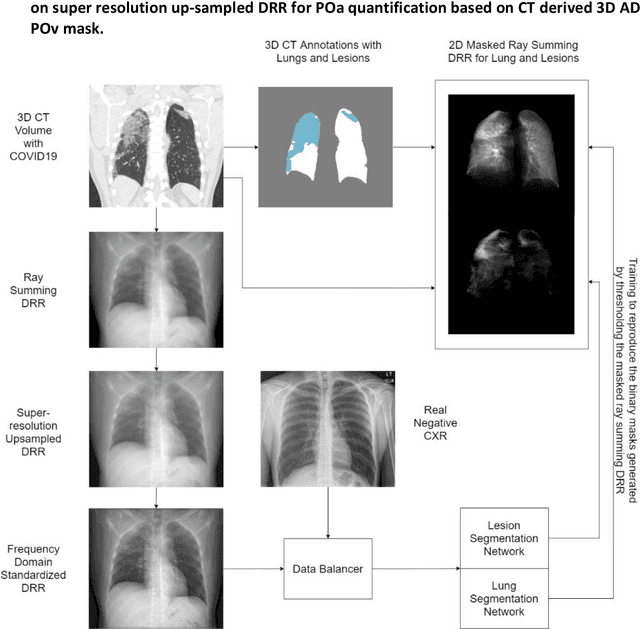
Abstract:Purpose: To leverage volumetric quantification of airspace disease (AD) derived from a superior modality (CT) serving as ground truth, projected onto digitally reconstructed radiographs (DRRs) to: 1) train a convolutional neural network to quantify airspace disease on paired CXRs; and 2) compare the DRR-trained CNN to expert human readers in the CXR evaluation of patients with confirmed COVID-19. Materials and Methods: We retrospectively selected a cohort of 86 COVID-19 patients (with positive RT-PCR), from March-May 2020 at a tertiary hospital in the northeastern USA, who underwent chest CT and CXR within 48 hrs. The ground truth volumetric percentage of COVID-19 related AD (POv) was established by manual AD segmentation on CT. The resulting 3D masks were projected into 2D anterior-posterior digitally reconstructed radiographs (DRR) to compute area-based AD percentage (POa). A convolutional neural network (CNN) was trained with DRR images generated from a larger-scale CT dataset of COVID-19 and non-COVID-19 patients, automatically segmenting lungs, AD and quantifying POa on CXR. CNN POa results were compared to POa quantified on CXR by two expert readers and to the POv ground-truth, by computing correlations and mean absolute errors. Results: Bootstrap mean absolute error (MAE) and correlations between POa and POv were 11.98% [11.05%-12.47%] and 0.77 [0.70-0.82] for average of expert readers, and 9.56%-9.78% [8.83%-10.22%] and 0.78-0.81 [0.73-0.85] for the CNN, respectively. Conclusion: Our CNN trained with DRR using CT-derived airspace quantification achieved expert radiologist level of accuracy in the quantification of airspace disease on CXR, in patients with positive RT-PCR for COVID-19.
Quantifying and Leveraging Predictive Uncertainty for Medical Image Assessment
Jul 08, 2020

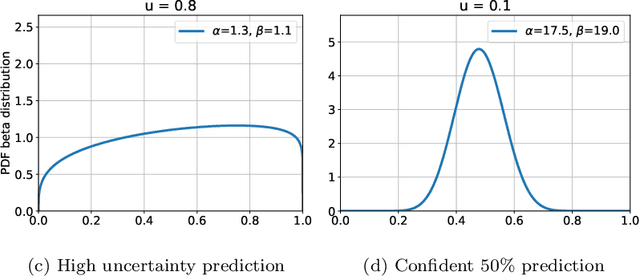
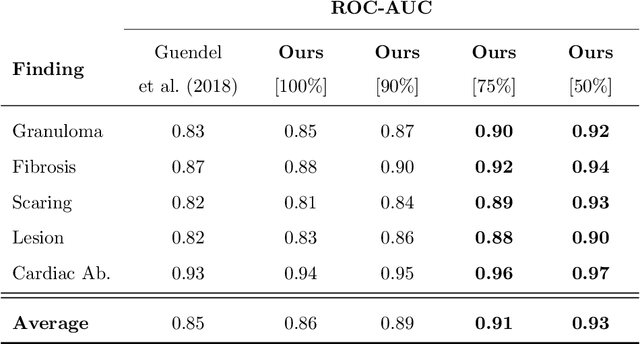
Abstract:The interpretation of medical images is a challenging task, often complicated by the presence of artifacts, occlusions, limited contrast and more. Most notable is the case of chest radiography, where there is a high inter-rater variability in the detection and classification of abnormalities. This is largely due to inconclusive evidence in the data or subjective definitions of disease appearance. An additional example is the classification of anatomical views based on 2D Ultrasound images. Often, the anatomical context captured in a frame is not sufficient to recognize the underlying anatomy. Current machine learning solutions for these problems are typically limited to providing probabilistic predictions, relying on the capacity of underlying models to adapt to limited information and the high degree of label noise. In practice, however, this leads to overconfident systems with poor generalization on unseen data. To account for this, we propose a system that learns not only the probabilistic estimate for classification, but also an explicit uncertainty measure which captures the confidence of the system in the predicted output. We argue that this approach is essential to account for the inherent ambiguity characteristic of medical images from different radiologic exams including computed radiography, ultrasonography and magnetic resonance imaging. In our experiments we demonstrate that sample rejection based on the predicted uncertainty can significantly improve the ROC-AUC for various tasks, e.g., by 8% to 0.91 with an expected rejection rate of under 25% for the classification of different abnormalities in chest radiographs. In addition, we show that using uncertainty-driven bootstrapping to filter the training data, one can achieve a significant increase in robustness and accuracy.
3D Tomographic Pattern Synthesis for Enhancing the Quantification of COVID-19
May 05, 2020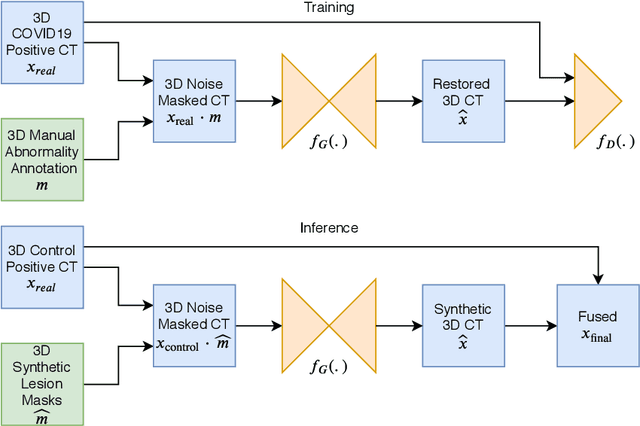
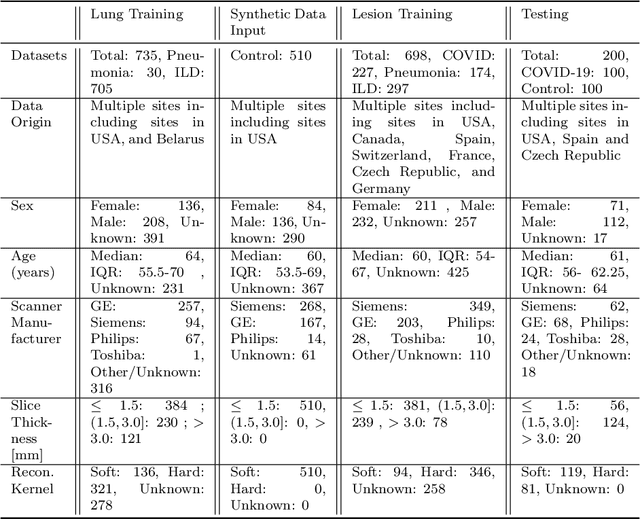
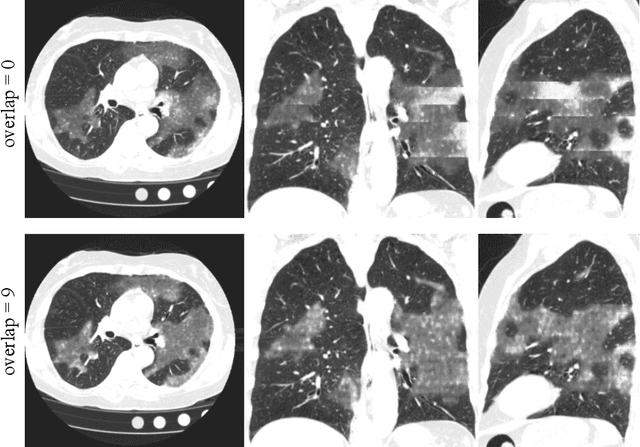
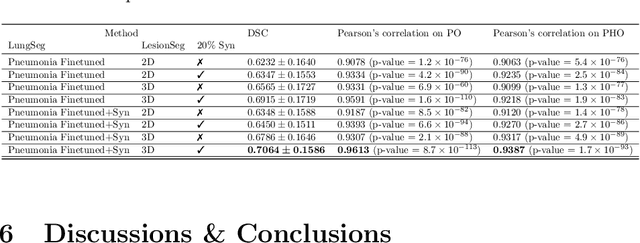
Abstract:The Coronavirus Disease (COVID-19) has affected 1.8 million people and resulted in more than 110,000 deaths as of April 12, 2020. Several studies have shown that tomographic patterns seen on chest Computed Tomography (CT), such as ground-glass opacities, consolidations, and crazy paving pattern, are correlated with the disease severity and progression. CT imaging can thus emerge as an important modality for the management of COVID-19 patients. AI-based solutions can be used to support CT based quantitative reporting and make reading efficient and reproducible if quantitative biomarkers, such as the Percentage of Opacity (PO), can be automatically computed. However, COVID-19 has posed unique challenges to the development of AI, specifically concerning the availability of appropriate image data and annotations at scale. In this paper, we propose to use synthetic datasets to augment an existing COVID-19 database to tackle these challenges. We train a Generative Adversarial Network (GAN) to inpaint COVID-19 related tomographic patterns on chest CTs from patients without infectious diseases. Additionally, we leverage location priors derived from manually labeled COVID-19 chest CTs patients to generate appropriate abnormality distributions. Synthetic data are used to improve both lung segmentation and segmentation of COVID-19 patterns by adding 20% of synthetic data to the real COVID-19 training data. We collected 2143 chest CTs, containing 327 COVID-19 positive cases, acquired from 12 sites across 7 countries. By testing on 100 COVID-19 positive and 100 control cases, we show that synthetic data can help improve both lung segmentation (+6.02% lesion inclusion rate) and abnormality segmentation (+2.78% dice coefficient), leading to an overall more accurate PO computation (+2.82% Pearson coefficient).
Quantification of Tomographic Patterns associated with COVID-19 from Chest CT
Apr 28, 2020


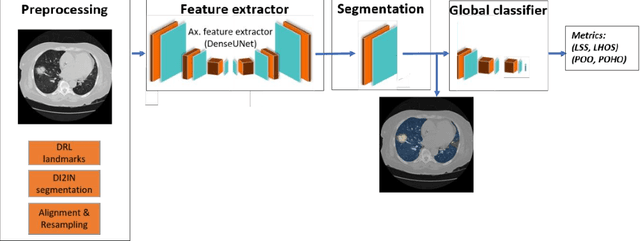
Abstract:Purpose: To present a method that automatically detects and quantifies abnormal tomographic patterns commonly present in COVID-19, namely Ground Glass Opacities (GGO) and consolidations. Given that high opacity abnormalities (i.e., consolidations) were shown to correlate with severe disease, the paper introduces two combined severity measures (Percentage of Opacity, Percentage of High Opacity) and (Lung Severity Score, Lung High Opacity Score). They quantify the extent of overall COVID-19 abnormalities and the presence of high opacity abnormalities, global and lobe-wise, respectively, being computed based on 3D segmentations of lesions, lungs, and lobes. Materials and Methods: The proposed method takes as input a non-contrasted Chest CT and segments the lesions, lungs, and lobes in 3D. It outputs two combined measures of the severity of lung/lobe involvement, quantifying both the extent of COVID-19 abnormalities and presence of high opacities, based on deep learning and deep reinforcement learning. The first measure (POO, POHO) is global, while the second (LSS, LHOS) is lobe-wise. Evaluation is reported on CTs of 100 subjects (50 COVID-19 confirmed and 50 controls) from institutions from Canada, Europe and US. Ground truth is established by manual annotations of lesions, lungs, and lobes. Results: Pearson Correlation Coefficient between method prediction and ground truth is 0.97 (POO), 0.98 (POHO), 0.96 (LSS), 0.96 (LHOS). Automated processing time to compute the severity scores is 10 seconds/case vs 30 mins needed for manual annotations. Conclusion: A new method identifies regions of abnormalities seen in COVID-19 non-contrasted Chest CT and computes (POO, POHO) and (LSS, LHOS) severity scores.
 Add to Chrome
 Add to Firefox
 Add to Edge