Tiffany Tang
Top-$k$ Feature Importance Ranking
Sep 18, 2025


Abstract:Accurate ranking of important features is a fundamental challenge in interpretable machine learning with critical applications in scientific discovery and decision-making. Unlike feature selection and feature importance, the specific problem of ranking important features has received considerably less attention. We introduce RAMPART (Ranked Attributions with MiniPatches And Recursive Trimming), a framework that utilizes any existing feature importance measure in a novel algorithm specifically tailored for ranking the top-$k$ features. Our approach combines an adaptive sequential halving strategy that progressively focuses computational resources on promising features with an efficient ensembling technique using both observation and feature subsampling. Unlike existing methods that convert importance scores to ranks as post-processing, our framework explicitly optimizes for ranking accuracy. We provide theoretical guarantees showing that RAMPART achieves the correct top-$k$ ranking with high probability under mild conditions, and demonstrate through extensive simulation studies that RAMPART consistently outperforms popular feature importance methods, concluding with a high-dimensional genomics case study.
The Future will be Different than Today: Model Evaluation Considerations when Developing Translational Clinical Biomarker
Jul 13, 2021


Abstract:Finding translational biomarkers stands center stage of the future of personalized medicine in healthcare. We observed notable challenges in identifying robust biomarkers as some with great performance in one scenario often fail to perform well in new trials (e.g. different population, indications). With rapid development in the clinical trial world (e.g. assay, disease definition), new trials very likely differ from legacy ones in many perspectives and in development of biomarkers this heterogeneity should be considered. In response, we recommend considering building in the heterogeneity when evaluating biomarkers. In this paper, we present one evaluation strategy by using leave-one-study-out (LOSO) in place of conventional cross-validation (cv) methods to account for the potential heterogeneity across trials used for building and testing the biomarkers. To demonstrate the performance of K-fold vs LOSO cv in estimating the effect size of biomarkers, we leveraged data from clinical trials and simulation studies. In our assessment, LOSO cv provided a more objective estimate of the future performance. This conclusion remained true across different evaluation metrics and different statistical methods.
Curating a COVID-19 data repository and forecasting county-level death counts in the United States
May 16, 2020


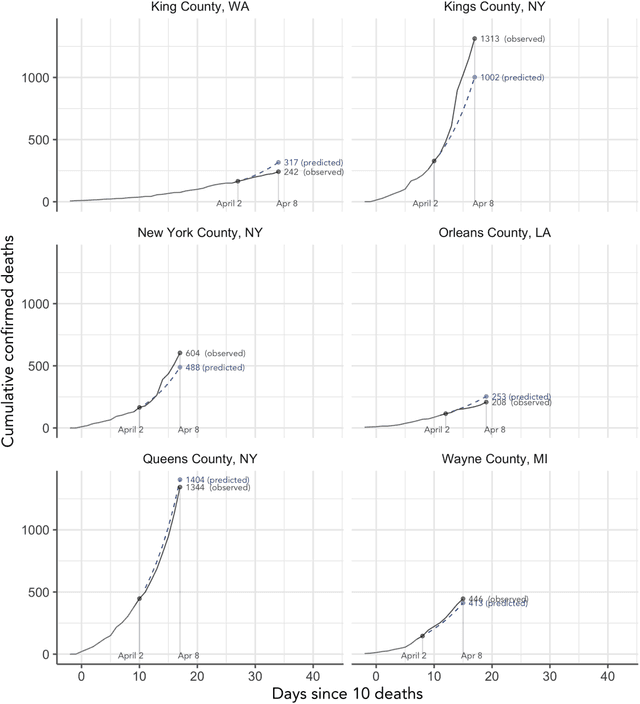
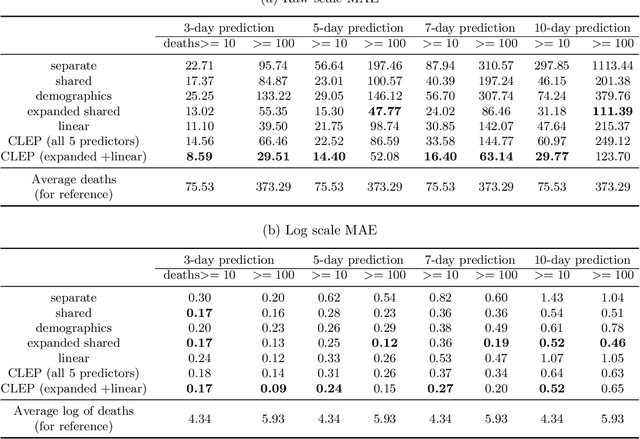
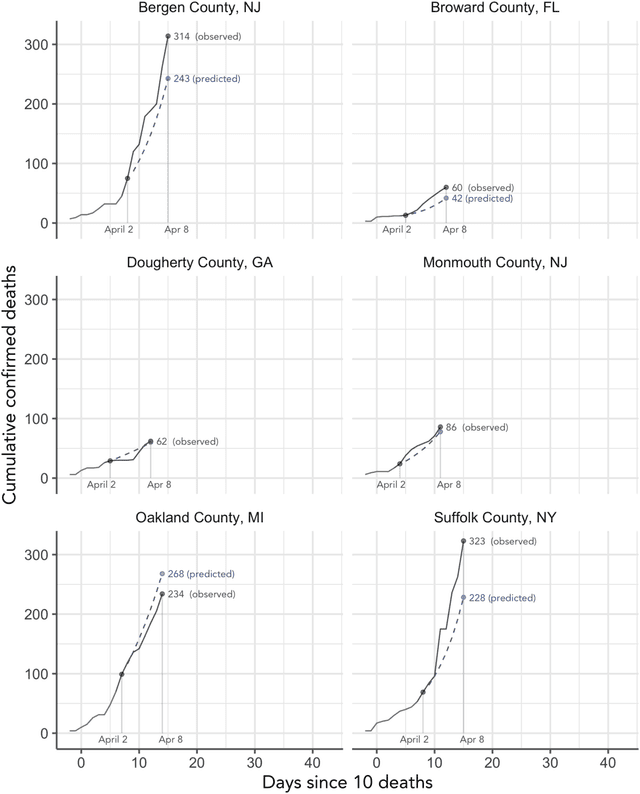
Abstract:As the COVID-19 outbreak continues to evolve, accurate forecasting continues to play an extremely important role in informing policy decisions. In this paper, we collate a large data repository containing COVID-19 information from a range of different sources. We use this data to develop several predictors and prediction intervals for forecasting the short-term (e.g., over the next week) trajectory of COVID-19-related recorded deaths at the county-level in the United States. Specifically, using data from January 22, 2020, to May 10, 2020, we produce several different predictors and combine their forecasts using ensembling techniques, resulting in an ensemble we refer to as Combined Linear and Exponential Predictors (CLEP). Our individual predictors include county-specific exponential and linear predictors, an exponential predictor that pools data together across counties, and a demographics-based exponential predictor. In addition, we use the largest prediction errors in the past five days to assess the uncertainty of our death predictions, resulting in prediction intervals that we refer to as Maximum (absolute) Error Prediction Intervals (MEPI). We show that MEPI is an effective method in practice with a 94.5\% coverage rate when averaged across counties. Our forecasts are already being used by the non-profit organization, Response4Life, to determine the medical supply need for individual hospitals and have directly contributed to the distribution of medical supplies across the country. We hope that our forecasts and data repository can help guide necessary county-specific decision-making and help counties prepare for their continued fight against COVID-19. All collected data, modeling code, forecasts, and visualizations are updated daily and available at \url{https://github.com/Yu-Group/covid19-severity-prediction}.
 Add to Chrome
 Add to Firefox
 Add to Edge