Silvia Liberata Ullo
An Efficient Machine Learning Framework for Forest Height Estimation from Multi-Polarimetric Multi-Baseline SAR data
Jul 28, 2025Abstract:Accurate forest height estimation is crucial for climate change monitoring and carbon cycle assessment. Synthetic Aperture Radar (SAR), particularly in multi-channel configurations, has provided support for a long time in 3D forest structure reconstruction through model-based techniques. More recently, data-driven approaches using Machine Learning (ML) and Deep Learning (DL) have enabled new opportunities for forest parameter retrieval. This paper introduces FGump, a forest height estimation framework by gradient boosting using multi-channel SAR processing with LiDAR profiles as Ground Truth(GT). Unlike typical ML and DL approaches that require large datasets and complex architectures, FGump ensures a strong balance between accuracy and computational efficiency, using a limited set of hand-designed features and avoiding heavy preprocessing (e.g., calibration and/or quantization). Evaluated under both classification and regression paradigms, the proposed framework demonstrates that the regression formulation enables fine-grained, continuous estimations and avoids quantization artifacts by resulting in more precise measurements without rounding. Experimental results confirm that FGump outperforms State-of-the-Art (SOTA) AI-based and classical methods, achieving higher accuracy and significantly lower training and inference times, as demonstrated in our results.
A Deep Learning Architecture for Land Cover Mapping Using Spatio-Temporal Sentinel-1 Features
Mar 10, 2025
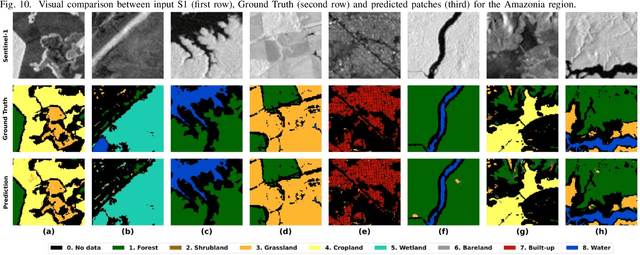
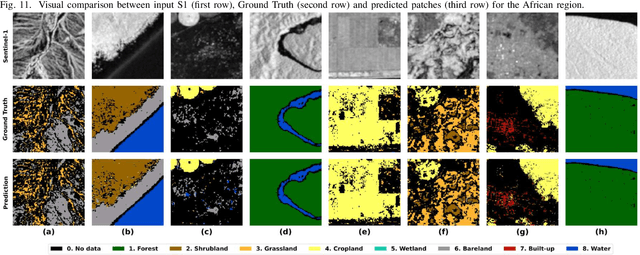
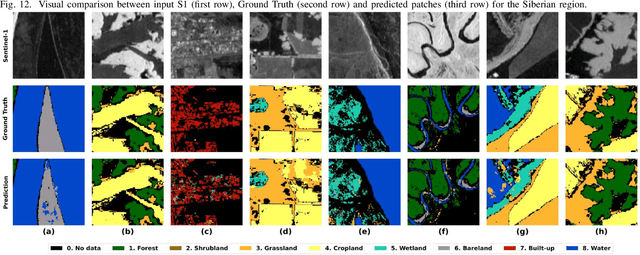
Abstract:Land Cover (LC) mapping using satellite imagery is critical for environmental monitoring and management. Deep Learning (DL), particularly Convolutional Neural Networks (CNNs) and Vision Transformers (ViTs), have revolutionized this field by enhancing the accuracy of classification tasks. In this work, a novel approach combining a transformer-based Swin-Unet architecture with seasonal synthesized spatio-temporal images has been employed to classify LC types using spatio-temporal features extracted from Sentinel-1 (S1) Synthetic Aperture Radar (SAR) data, organized into seasonal clusters. The study focuses on three distinct regions - Amazonia, Africa, and Siberia - and evaluates the model performance across diverse ecoregions within these areas. By utilizing seasonal feature sequences instead of dense temporal sequences, notable performance improvements have been achieved, especially in regions with temporal data gaps like Siberia, where S1 data distribution is uneven and non-uniform. The results demonstrate the effectiveness and the generalization capabilities of the proposed methodology in achieving high overall accuracy (O.A.) values, even in regions with limited training data.
DiffFormer: a Differential Spatial-Spectral Transformer for Hyperspectral Image Classification
Dec 23, 2024


Abstract:Hyperspectral image classification (HSIC) has gained significant attention because of its potential in analyzing high-dimensional data with rich spectral and spatial information. In this work, we propose the Differential Spatial-Spectral Transformer (DiffFormer), a novel framework designed to address the inherent challenges of HSIC, such as spectral redundancy and spatial discontinuity. The DiffFormer leverages a Differential Multi-Head Self-Attention (DMHSA) mechanism, which enhances local feature discrimination by introducing differential attention to accentuate subtle variations across neighboring spectral-spatial patches. The architecture integrates Spectral-Spatial Tokenization through three-dimensional (3D) convolution-based patch embeddings, positional encoding, and a stack of transformer layers equipped with the SWiGLU activation function for efficient feature extraction (SwiGLU is a variant of the Gated Linear Unit (GLU) activation function). A token-based classification head further ensures robust representation learning, enabling precise labeling of hyperspectral pixels. Extensive experiments on benchmark hyperspectral datasets demonstrate the superiority of DiffFormer in terms of classification accuracy, computational efficiency, and generalizability, compared to existing state-of-the-art (SOTA) methods. In addition, this work provides a detailed analysis of computational complexity, showcasing the scalability of the model for large-scale remote sensing applications. The source code will be made available at \url{https://github.com/mahmad000/DiffFormer} after the first round of revision.
Benchmarking of a new data splitting method on volcanic eruption data
Oct 08, 2024


Abstract:In this paper, a novel method for data splitting is presented: an iterative procedure divides the input dataset of volcanic eruption, chosen as the proposed use case, into two parts using a dissimilarity index calculated on the cumulative histograms of these two parts. The Cumulative Histogram Dissimilarity (CHD) index is introduced as part of the design. Based on the obtained results the proposed model in this case, compared to both Random splitting and K-means implemented over different configurations, achieves the best performance, with a slightly higher number of epochs. However, this demonstrates that the model can learn more deeply from the input dataset, which is attributable to the quality of the splitting. In fact, each model was trained with early stopping, suitable in case of overfitting, and the higher number of epochs in the proposed method demonstrates that early stopping did not detect overfitting, and consequently, the learning was optimal.
SEN12-WATER: A New Dataset for Hydrological Applications and its Benchmarking
Sep 25, 2024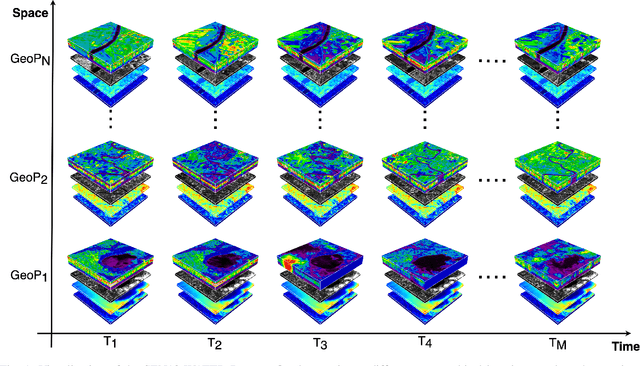
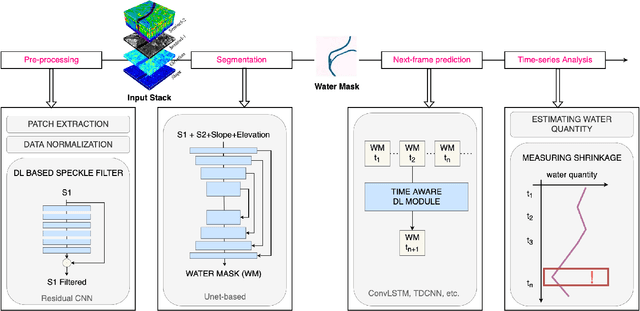
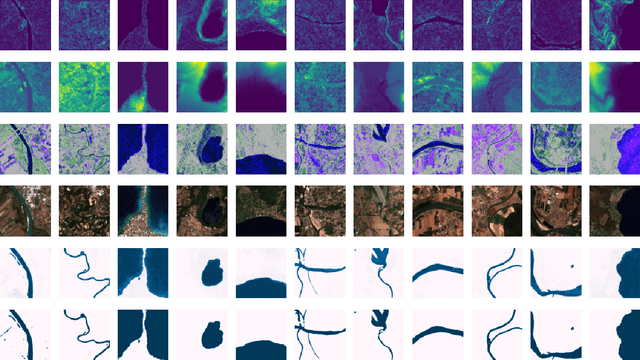
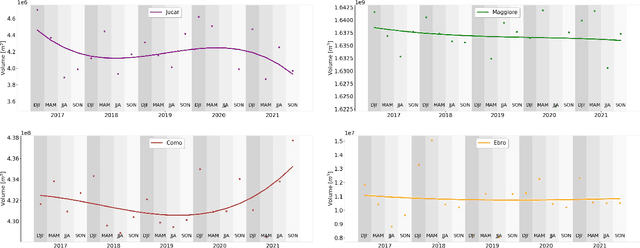
Abstract:Climate change and increasing droughts pose significant challenges to water resource management around the world. These problems lead to severe water shortages that threaten ecosystems, agriculture, and human communities. To advance the fight against these challenges, we present a new dataset, SEN12-WATER, along with a benchmark using a novel end-to-end Deep Learning (DL) framework for proactive drought-related analysis. The dataset, identified as a spatiotemporal datacube, integrates SAR polarization, elevation, slope, and multispectral optical bands. Our DL framework enables the analysis and estimation of water losses over time in reservoirs of interest, revealing significant insights into water dynamics for drought analysis by examining temporal changes in physical quantities such as water volume. Our methodology takes advantage of the multitemporal and multimodal characteristics of the proposed dataset, enabling robust generalization and advancing understanding of drought, contributing to climate change resilience and sustainable water resource management. The proposed framework involves, among the several components, speckle noise removal from SAR data, a water body segmentation through a U-Net architecture, the time series analysis, and the predictive capability of a Time-Distributed-Convolutional Neural Network (TD-CNN). Results are validated through ground truth data acquired on-ground via dedicated sensors and (tailored) metrics, such as Precision, Recall, Intersection over Union, Mean Squared Error, Structural Similarity Index Measure and Peak Signal-to-Noise Ratio.
QSpeckleFilter: a Quantum Machine Learning approach for SAR speckle filtering
Feb 02, 2024


Abstract:The use of Synthetic Aperture Radar (SAR) has greatly advanced our capacity for comprehensive Earth monitoring, providing detailed insights into terrestrial surface use and cover regardless of weather conditions, and at any time of day or night. However, SAR imagery quality is often compromised by speckle, a granular disturbance that poses challenges in producing accurate results without suitable data processing. In this context, the present paper explores the cutting-edge application of Quantum Machine Learning (QML) in speckle filtering, harnessing quantum algorithms to address computational complexities. We introduce here QSpeckleFilter, a novel QML model for SAR speckle filtering. The proposed method compared to a previous work from the same authors showcases its superior performance in terms of Peak Signal-to-Noise Ratio (PSNR) and Structural Similarity Index Measure (SSIM) on a testing dataset, and it opens new avenues for Earth Observation (EO) applications.
A Hybrid MLP-Quantum approach in Graph Convolutional Neural Networks for Oceanic Nino Index prediction
Jan 29, 2024Abstract:This paper explores an innovative fusion of Quantum Computing (QC) and Artificial Intelligence (AI) through the development of a Hybrid Quantum Graph Convolutional Neural Network (HQGCNN), combining a Graph Convolutional Neural Network (GCNN) with a Quantum Multilayer Perceptron (MLP). The study highlights the potentialities of GCNNs in handling global-scale dependencies and proposes the HQGCNN for predicting complex phenomena such as the Oceanic Nino Index (ONI). Preliminary results suggest the model potential to surpass state-of-the-art (SOTA). The code will be made available with the paper publication.
Monitoring water contaminants in coastal areas through ML algorithms leveraging atmospherically corrected Sentinel-2 data
Jan 08, 2024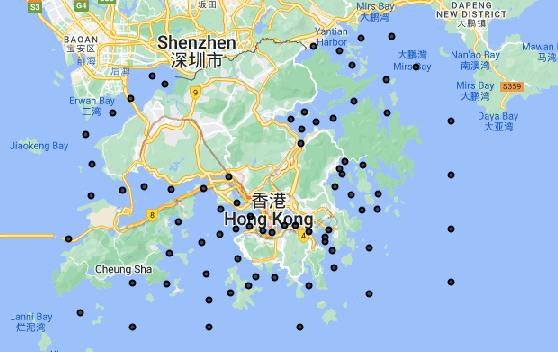

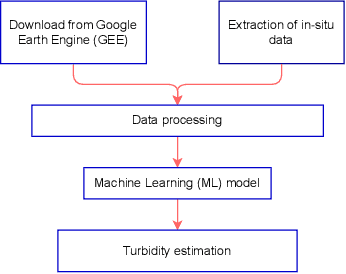

Abstract:Monitoring water contaminants is of paramount importance, ensuring public health and environmental well-being. Turbidity, a key parameter, poses a significant problem, affecting water quality. Its accurate assessment is crucial for safeguarding ecosystems and human consumption, demanding meticulous attention and action. For this, our study pioneers a novel approach to monitor the Turbidity contaminant, integrating CatBoost Machine Learning (ML) with high-resolution data from Sentinel-2 Level-2A. Traditional methods are labor-intensive while CatBoost offers an efficient solution, excelling in predictive accuracy. Leveraging atmospherically corrected Sentinel-2 data through the Google Earth Engine (GEE), our study contributes to scalable and precise Turbidity monitoring. A specific tabular dataset derived from Hong Kong contaminants monitoring stations enriches our study, providing region-specific insights. Results showcase the viability of this integrated approach, laying the foundation for adopting advanced techniques in global water quality management.
Multitemporal analysis in Google Earth Engine for detecting urban changes using optical data and machine learning algorithms
Aug 22, 2023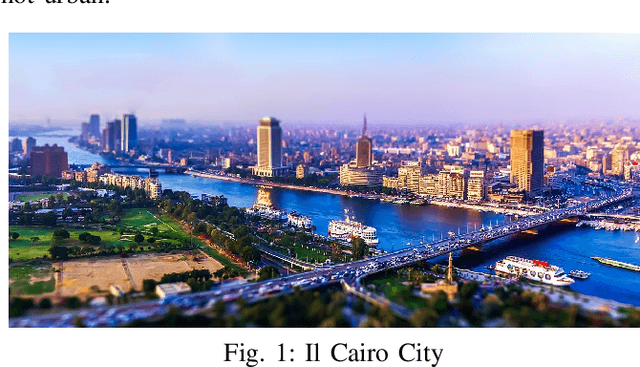
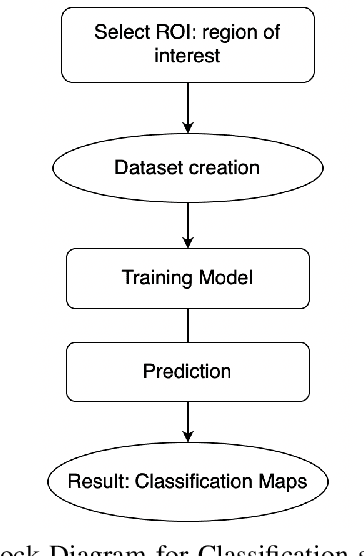


Abstract:The aim of this work is to perform a multitemporal analysis using the Google Earth Engine (GEE) platform for the detection of changes in urban areas using optical data and specific machine learning (ML) algorithms. As a case study, Cairo City has been identified, in Egypt country, as one of the five most populous megacities of the last decade in the world. Classification and change detection analysis of the region of interest (ROI) have been carried out from July 2013 to July 2021. Results demonstrate the validity of the proposed method in identifying changed and unchanged urban areas over the selected period. Furthermore, this work aims to evidence the growing significance of GEE as an efficient cloud-based solution for managing large quantities of satellite data.
Integration of Sentinel-1 and Sentinel-2 data for Earth surface classification using Machine Learning algorithms implemented on Google Earth Engine
Aug 22, 2023


Abstract:In this study, Synthetic Aperture Radar (SAR) and optical data are both considered for Earth surface classification. Specifically, the integration of Sentinel-1 (S-1) and Sentinel-2 (S-2) data is carried out through supervised Machine Learning (ML) algorithms implemented on the Google Earth Engine (GEE) platform for the classification of a particular region of interest. Achieved results demonstrate how in this case radar and optical remote detection provide complementary information, benefiting surface cover classification and generally leading to increased mapping accuracy. In addition, this paper works in the direction of proving the emerging role of GEE as an effective cloud-based tool for handling large amounts of satellite data.
 Add to Chrome
 Add to Firefox
 Add to Edge