 Add to Chrome
 Add to Firefox
 Add to Edge
OdysseyArena: Benchmarking Large Language Models For Long-Horizon, Active and Inductive Interactions
Feb 05, 2026The rapid advancement of Large Language Models (LLMs) has catalyzed the development of autonomous agents capable of navigating complex environments. However, existing evaluations primarily adopt a deductive paradigm, where agents execute tasks based on explicitly provided rules and static goals, often within limited planning horizons. Crucially, this neglects the inductive necessity for agents to discover latent transition laws from experience autonomously, which is the cornerstone for enabling agentic foresight and sustaining strategic coherence. To bridge this gap, we introduce OdysseyArena, which re-centers agent evaluation on long-horizon, active, and inductive interactions. We formalize and instantiate four primitives, translating abstract transition dynamics into concrete interactive environments. Building upon this, we establish OdysseyArena-Lite for standardized benchmarking, providing a set of 120 tasks to measure an agent's inductive efficiency and long-horizon discovery. Pushing further, we introduce OdysseyArena-Challenge to stress-test agent stability across extreme interaction horizons (e.g., > 200 steps). Extensive experiments on 15+ leading LLMs reveal that even frontier models exhibit a deficiency in inductive scenarios, identifying a critical bottleneck in the pursuit of autonomous discovery in complex environments. Our code and data are available at https://github.com/xufangzhi/Odyssey-Arena
SketchVL: Policy Optimization via Fine-Grained Credit Assignment for Chart Understanding and More
Jan 09, 2026Charts are high-density visual carriers of complex data and medium for information extraction and analysis. Due to the need for precise and complex visual reasoning, automated chart understanding poses a significant challenge to existing Multimodal Large Language Models (MLLMs). Many MLLMs trained with reinforcement learning (RL) face the challenge of credit assignment. Their advantage estimation, typically performed at the trajectory level, cannot distinguish between correct and incorrect reasoning steps within a single generated response. To address this limitation, we introduce SketchVL, a novel MLLM that optimized with FinePO, a new RL algorithm designed for fine-grained credit assignment within each trajectory. SketchVL's methodology involves drawing its intermediate reasoning steps as markers on the image and feeding the annotated image back to itself, creating a robust, multi-step reasoning process. During training, the FinePO algorithm leverages a Fine-grained Process Reward Model (FinePRM) to score each drawing action within a trajectory, thereby precisely assigning credit for each step. This mechanism allows FinePO to more strongly reward correct tokens when a trajectory is globally successful, and more heavily penalize incorrect tokens when the trajectory is globally suboptimal, thus achieving fine-grained reinforcement signals. Experiments show that SketchVL learns to align its step-level behavior with the FinePRM, achieving an average performance gain of 7.23\% over its base model across chart datasets, natural image datasets, and mathematics, providing a promising new direction for training powerful reasoning models.
ChartSketcher: Reasoning with Multimodal Feedback and Reflection for Chart Understanding
May 25, 2025Charts are high-density visualization carriers for complex data, serving as a crucial medium for information extraction and analysis. Automated chart understanding poses significant challenges to existing multimodal large language models (MLLMs) due to the need for precise and complex visual reasoning. Current step-by-step reasoning models primarily focus on text-based logical reasoning for chart understanding. However, they struggle to refine or correct their reasoning when errors stem from flawed visual understanding, as they lack the ability to leverage multimodal interaction for deeper comprehension. Inspired by human cognitive behavior, we propose ChartSketcher, a multimodal feedback-driven step-by-step reasoning method designed to address these limitations. ChartSketcher is a chart understanding model that employs Sketch-CoT, enabling MLLMs to annotate intermediate reasoning steps directly onto charts using a programmatic sketching library, iteratively feeding these visual annotations back into the reasoning process. This mechanism enables the model to visually ground its reasoning and refine its understanding over multiple steps. We employ a two-stage training strategy: a cold start phase to learn sketch-based reasoning patterns, followed by off-policy reinforcement learning to enhance reflection and generalization. Experiments demonstrate that ChartSketcher achieves promising performance on chart understanding benchmarks and general vision tasks, providing an interactive and interpretable approach to chart comprehension.
DiagramQG: A Dataset for Generating Concept-Focused Questions from Diagrams
Nov 26, 2024


Visual Question Generation (VQG) has gained significant attention due to its potential in educational applications. However, VQG researches mainly focus on natural images, neglecting diagrams in educational materials used to assess students' conceptual understanding. To address this gap, we introduce DiagramQG, a dataset containing 8,372 diagrams and 19,475 questions across various subjects. DiagramQG introduces concept and target text constraints, guiding the model to generate concept-focused questions for educational purposes. Meanwhile, we present the Hierarchical Knowledge Integration framework for Diagram Question Generation (HKI-DQG) as a strong baseline. This framework obtains multi-scale patches of diagrams and acquires knowledge using a visual language model with frozen parameters. It then integrates knowledge, text constraints and patches to generate concept-focused questions. We evaluate the performance of existing VQG models, open-source and closed-source vision-language models, and HKI-DQG on the DiagramQG dataset. Our HKI-DQG outperform existing methods, demonstrating that it serves as a strong baseline. Furthermore, to assess its generalizability, we apply HKI-DQG to two other VQG datasets of natural images, namely VQG-COCO and K-VQG, achieving state-of-the-art performance.The dataset and code are available at https://dxzxy12138.github.io/diagramqg-home.
GoT-CQA: Graph-of-Thought Guided Compositional Reasoning for Chart Question Answering
Sep 04, 2024
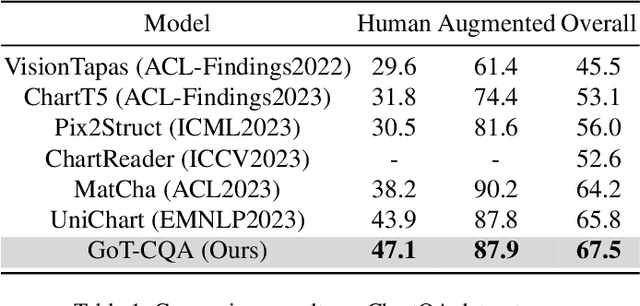
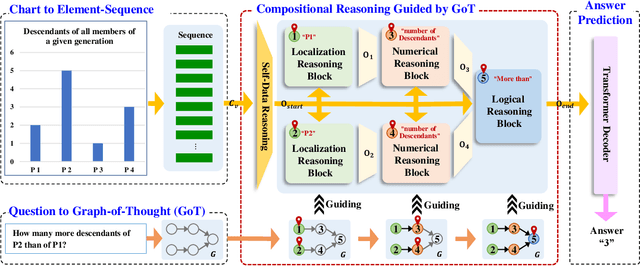
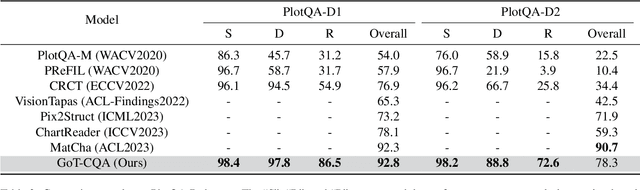
Chart Question Answering (CQA) aims at answering questions based on the visual chart content, which plays an important role in chart sumarization, business data analysis, and data report generation. CQA is a challenging multi-modal task because of the strong context dependence and complex reasoning requirement. The former refers to answering this question strictly based on the analysis of the visual content or internal data of the given chart, while the latter emphasizes the various logical and numerical reasoning involved in answer prediction process. In this paper, we pay more attention on the complex reasoning in CQA task, and propose a novel Graph-of-Thought (GoT) guided compositional reasoning model called GoT-CQA to overcome this problem. At first, we transform the chart-oriented question into a directed acyclic GoT composed of multiple operator nodes, including localization, numerical and logical operator. It intuitively reflects the human brain's solution process to this question. After that, we design an efficient auto-compositional reasoning framework guided by the GoT, to excute the multi-step reasoning operations in various types of questions. Comprehensive experiments on ChartQA and PlotQA-D datasets show that GoT-CQA achieves outstanding performance, especially in complex human-written and reasoning questions, comparing with the latest popular baselines.
VProChart: Answering Chart Question through Visual Perception Alignment Agent and Programmatic Solution Reasoning
Sep 03, 2024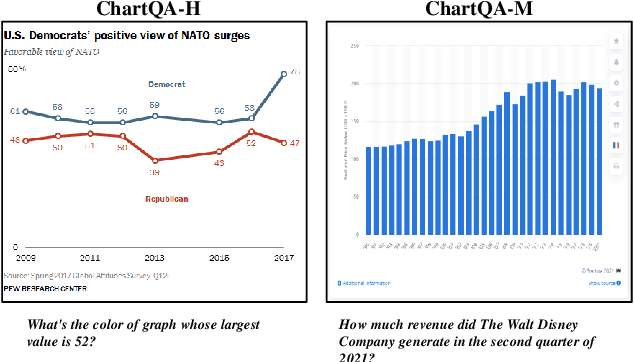


Charts are widely used for data visualization across various fields, including education, research, and business. Chart Question Answering (CQA) is an emerging task focused on the automatic interpretation and reasoning of data presented in charts. However, chart images are inherently difficult to interpret, and chart-related questions often involve complex logical and numerical reasoning, which hinders the performance of existing models. This paper introduces VProChart, a novel framework designed to address these challenges in CQA by integrating a lightweight Visual Perception Alignment Agent (VPAgent) and a Programmatic Solution Reasoning approach. VPAgent aligns and models chart elements based on principles of human visual perception, enhancing the understanding of chart context. The Programmatic Solution Reasoning approach leverages large language models (LLMs) to transform natural language reasoning questions into structured solution programs, facilitating precise numerical and logical reasoning. Extensive experiments on benchmark datasets such as ChartQA and PlotQA demonstrate that VProChart significantly outperforms existing methods, highlighting its capability in understanding and reasoning with charts.
EvoChart: A Benchmark and a Self-Training Approach Towards Real-World Chart Understanding
Sep 03, 2024

Chart understanding enables automated data analysis for humans, which requires models to achieve highly accurate visual comprehension. While existing Visual Language Models (VLMs) have shown progress in chart understanding, the lack of high-quality training data and comprehensive evaluation benchmarks hinders VLM chart comprehension. In this paper, we introduce EvoChart, a novel self-training method for generating synthetic chart data to enhance VLMs' capabilities in real-world chart comprehension. We also propose EvoChart-QA, a noval benchmark for measuring models' chart comprehension abilities in real-world scenarios. Specifically, EvoChart is a unique self-training data synthesis approach that simultaneously produces high-quality training corpus and a high-performance chart understanding model. EvoChart-QA consists of 650 distinct real-world charts collected from 140 different websites and 1,250 expert-curated questions that focus on chart understanding. Experimental results on various open-source and proprietary VLMs tested on EvoChart-QA demonstrate that even the best proprietary model, GPT-4o, achieves only 49.8% accuracy. Moreover, the EvoChart method significantly boosts the performance of open-source VLMs on real-world chart understanding tasks, achieving 54.2% accuracy on EvoChart-QA.