Jakob Raymaekers
Independent Component Analysis by Robust Distance Correlation
May 14, 2025Abstract:Independent component analysis (ICA) is a powerful tool for decomposing a multivariate signal or distribution into fully independent sources, not just uncorrelated ones. Unfortunately, most approaches to ICA are not robust against outliers. Here we propose a robust ICA method called RICA, which estimates the components by minimizing a robust measure of dependence between multivariate random variables. The dependence measure used is the distance correlation (dCor). In order to make it more robust we first apply a new transformation called the bowl transform, which is bounded, one-to-one, continuous, and maps far outliers to points close to the origin. This preserves the crucial property that a zero dCor implies independence. RICA estimates the independent sources sequentially, by looking for the component that has the smallest dCor with the remainder. RICA is strongly consistent and has the usual parametric rate of convergence. Its robustness is investigated by a simulation study, in which it generally outperforms its competitors. The method is illustrated on three applications, including the well-known cocktail party problem.
RobPy: a Python Package for Robust Statistical Methods
Nov 04, 2024Abstract:Robust estimation provides essential tools for analyzing data that contain outliers, ensuring that statistical models remain reliable even in the presence of some anomalous data. While robust methods have long been available in R, users of Python have lacked a comprehensive package that offers these methods in a cohesive framework. RobPy addresses this gap by offering a wide range of robust methods in Python, built upon established libraries including NumPy, SciPy, and scikit-learn. This package includes tools for robust preprocessing, univariate estimation, covariance matrices, regression, and principal component analysis, which are able to detect outliers and to mitigate their effect. In addition, RobPy provides specialized diagnostic plots for visualizing casewise and cellwise outliers. This paper presents the structure of the RobPy package, demonstrates its functionality through examples, and compares its features to existing implementations in other statistical software. By bringing robust methods to Python, RobPy enables more users to perform robust data analysis in a modern and versatile programming language.
TSLiNGAM: DirectLiNGAM under heavy tails
Aug 10, 2023Abstract:One of the established approaches to causal discovery consists of combining directed acyclic graphs (DAGs) with structural causal models (SCMs) to describe the functional dependencies of effects on their causes. Possible identifiability of SCMs given data depends on assumptions made on the noise variables and the functional classes in the SCM. For instance, in the LiNGAM model, the functional class is restricted to linear functions and the disturbances have to be non-Gaussian. In this work, we propose TSLiNGAM, a new method for identifying the DAG of a causal model based on observational data. TSLiNGAM builds on DirectLiNGAM, a popular algorithm which uses simple OLS regression for identifying causal directions between variables. TSLiNGAM leverages the non-Gaussianity assumption of the error terms in the LiNGAM model to obtain more efficient and robust estimation of the causal structure. TSLiNGAM is justified theoretically and is studied empirically in an extensive simulation study. It performs significantly better on heavy-tailed and skewed data and demonstrates a high small-sample efficiency. In addition, TSLiNGAM also shows better robustness properties as it is more resilient to contamination.
Fast Linear Model Trees by PILOT
Feb 08, 2023Abstract:Linear model trees are regression trees that incorporate linear models in the leaf nodes. This preserves the intuitive interpretation of decision trees and at the same time enables them to better capture linear relationships, which is hard for standard decision trees. But most existing methods for fitting linear model trees are time consuming and therefore not scalable to large data sets. In addition, they are more prone to overfitting and extrapolation issues than standard regression trees. In this paper we introduce PILOT, a new algorithm for linear model trees that is fast, regularized, stable and interpretable. PILOT trains in a greedy fashion like classic regression trees, but incorporates an $L^2$ boosting approach and a model selection rule for fitting linear models in the nodes. The abbreviation PILOT stands for $PI$ecewise $L$inear $O$rganic $T$ree, where `organic' refers to the fact that no pruning is carried out. PILOT has the same low time and space complexity as CART without its pruning. An empirical study indicates that PILOT tends to outperform standard decision trees and other linear model trees on a variety of data sets. Moreover, we prove its consistency in an additive model setting under weak assumptions. When the data is generated by a linear model, the convergence rate is polynomial.
The Cellwise Minimum Covariance Determinant Estimator
Jul 27, 2022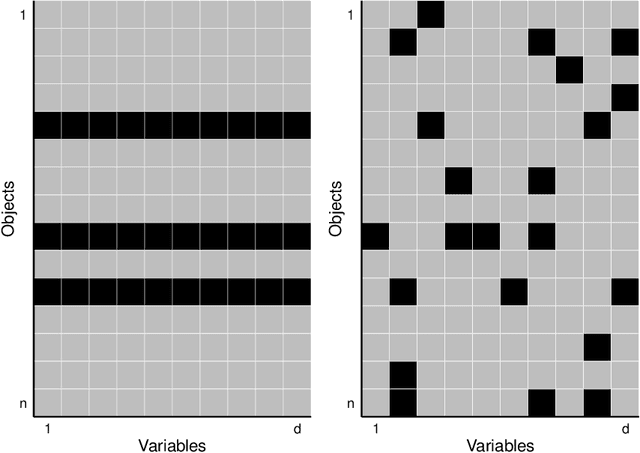
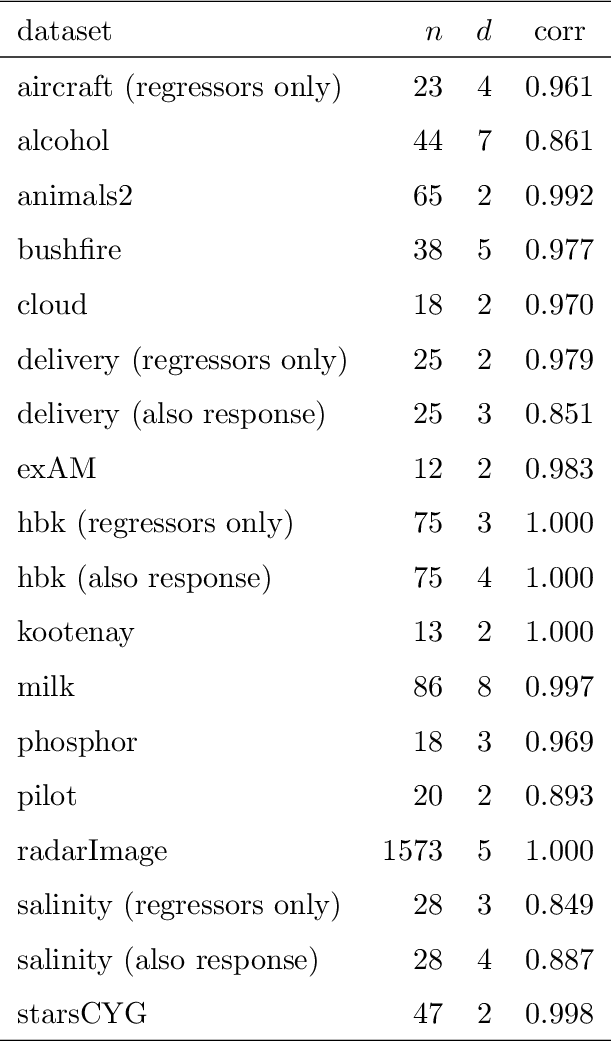
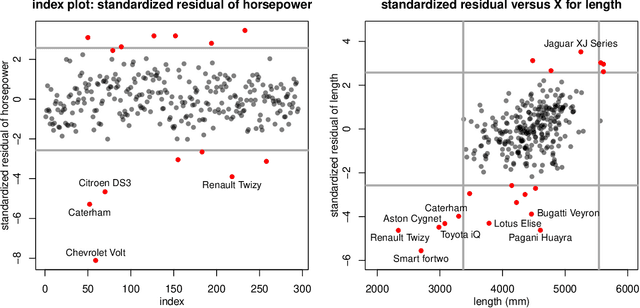
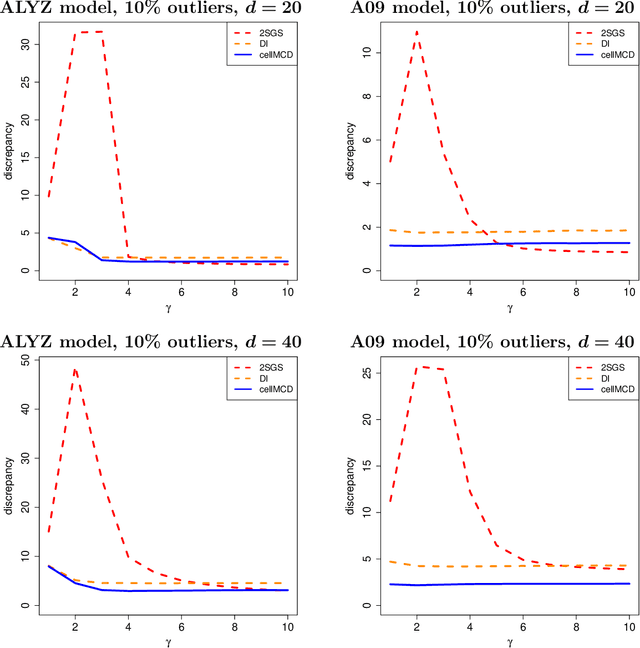
Abstract:The usual Minimum Covariance Determinant (MCD) estimator of a covariance matrix is robust against casewise outliers. These are cases (that is, rows of the data matrix) that behave differently from the majority of cases, raising suspicion that they might belong to a different population. On the other hand, cellwise outliers are individual cells in the data matrix. When a row contains one or more outlying cells, the other cells in the same row still contain useful information that we wish to preserve. We propose a cellwise robust version of the MCD method, called cellMCD. Its main building blocks are observed likelihood and a sparsity penalty on the number of flagged cellwise outliers. It possesses good breakdown properties. We construct a fast algorithm for cellMCD based on concentration steps (C-steps) that always lower the objective. The method performs well in simulations with cellwise outliers, and has high finite-sample efficiency on clean data. It is illustrated on real data with visualizations of the results.
Silhouettes and quasi residual plots for neural nets and tree-based classifiers
Jun 16, 2021
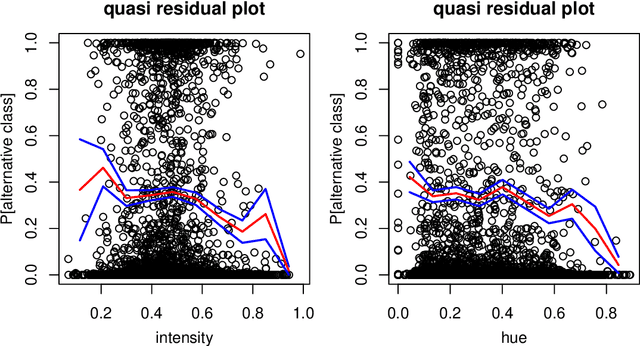


Abstract:Classification by neural nets and by tree-based methods are powerful tools of machine learning. There exist interesting visualizations of the inner workings of these and other classifiers. Here we pursue a different goal, which is to visualize the cases being classified, either in training data or in test data. An important aspect is whether a case has been classified to its given class (label) or whether the classifier wants to assign it to different class. This is reflected in the (conditional and posterior) probability of the alternative class (PAC). A high PAC indicates label bias, i.e. the possibility that the case was mislabeled. The PAC is used to construct a silhouette plot which is similar in spirit to the silhouette plot for cluster analysis (Rousseeuw, 1987). The average silhouette width can be used to compare different classifications of the same dataset. We will also draw quasi residual plots of the PAC versus a data feature, which may lead to more insight in the data. One of these data features is how far each case lies from its given class. The graphical displays are illustrated and interpreted on benchmark data sets containing images, mixed features, and tweets.
Weight-of-evidence 2.0 with shrinkage and spline-binning
Feb 02, 2021
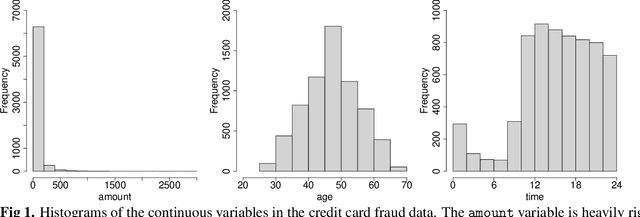

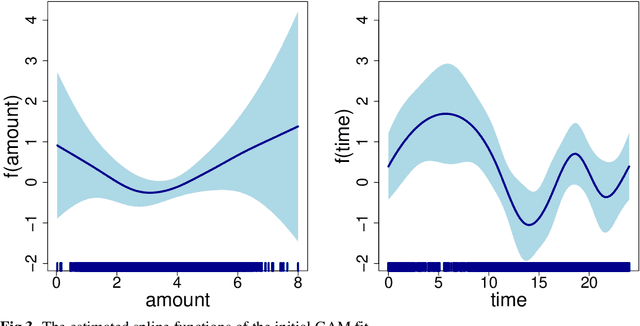
Abstract:In many practical applications, such as fraud detection, credit risk modeling or medical decision making, classification models for assigning instances to a predefined set of classes are required to be both precise as well as interpretable. Linear modeling methods such as logistic regression are often adopted, since they offer an acceptable balance between precision and interpretability. Linear methods, however, are not well equipped to handle categorical predictors with high-cardinality or to exploit non-linear relations in the data. As a solution, data preprocessing methods such as weight-of-evidence are typically used for transforming the predictors. The binning procedure that underlies the weight-of-evidence approach, however, has been little researched and typically relies on ad-hoc or expert driven procedures. The objective in this paper, therefore, is to propose a formalized, data-driven and powerful method. To this end, we explore the discretization of continuous variables through the binning of spline functions, which allows for capturing non-linear effects in the predictor variables and yields highly interpretable predictors taking only a small number of discrete values. Moreover, we extend upon the weight-of-evidence approach and propose to estimate the proportions using shrinkage estimators. Together, this offers an improved ability to exploit both non-linear and categorical predictors for achieving increased classification precision, while maintaining interpretability of the resulting model and decreasing the risk of overfitting. We present the results of a series of experiments in a fraud detection setting, which illustrate the effectiveness of the presented approach. We facilitate reproduction of the presented results and adoption of the proposed approaches by providing both the dataset and the code for implementing the experiments and the presented approach.
Regularized K-means through hard-thresholding
Oct 02, 2020

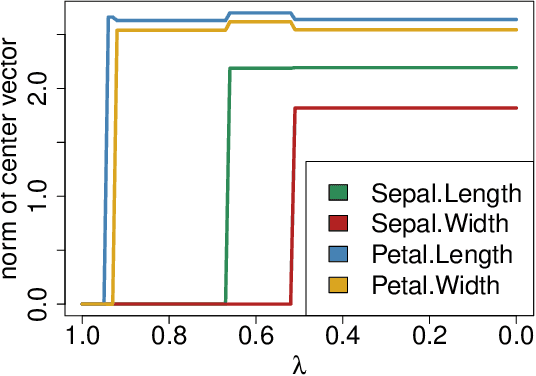
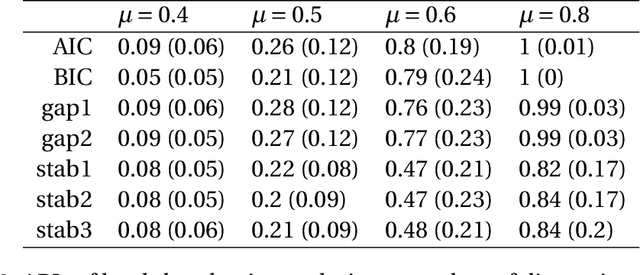
Abstract:We study a framework of regularized $K$-means methods based on direct penalization of the size of the cluster centers. Different penalization strategies are considered and compared through simulation and theoretical analysis. Based on the results, we propose HT $K$-means, which uses an $\ell_0$ penalty to induce sparsity in the variables. Different techniques for selecting the tuning parameter are discussed and compared. The proposed method stacks up favorably with the most popular regularized $K$-means methods in an extensive simulation study. Finally, HT $K$-means is applied to several real data examples. Graphical displays are presented and used in these examples to gain more insight into the datasets.
Visualizing classification results
Jul 28, 2020


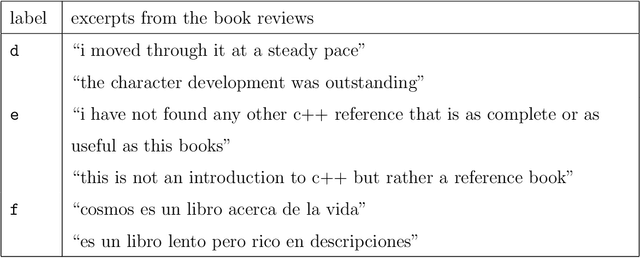
Abstract:Classification is a major tool of statistics and machine learning. A classification method first processes a training set of objects with given classes (labels), with the goal of afterward assigning new objects to one of these classes. When running the resulting prediction method on the training data or on test data, it can happen that an object is predicted to lie in a class that differs from its given label. This is sometimes called label bias, and raises the question whether the object was mislabeled.Our goal is to visualize aspects of the data classification to obtain insight. The proposed display reflects to what extent each object's label is (dis)similar to its prediction, how far each object lies from the other objects in its class, and whether some objects lie far from all classes. The display is constructed for discriminant analysis, the k-nearest neighbor classifier, support vector machines, logistic regression, and majority voting. It is illustrated on several benchmark datasets containing images and texts.
Transforming variables to central normality
May 16, 2020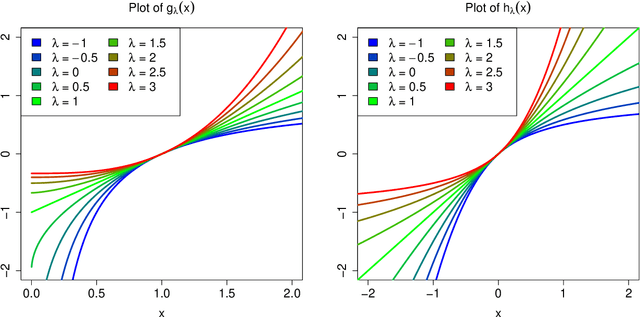
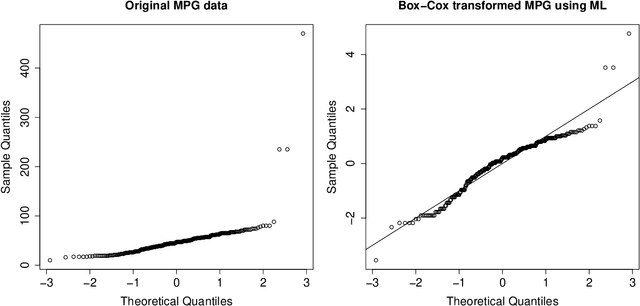

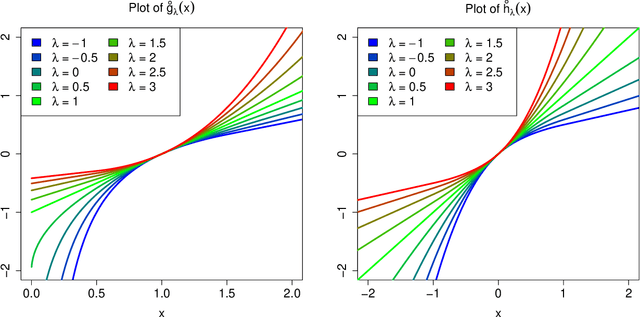
Abstract:Many real data sets contain features (variables) whose distribution is far from normal (gaussian). Instead, their distribution is often skewed. In order to handle such data it is customary to preprocess the variables to make them more normal. The Box-Cox and Yeo-Johnson transformations are well-known tools for this. However, the standard maximum likelihood estimator of their transformation parameter is highly sensitive to outliers, and will often try to move outliers inward at the expense of the normality of the central part of the data. We propose an automatic preprocessing technique that is robust against such outliers, which transforms the data to central normality. It compares favorably to existing techniques in an extensive simulation study and on real data.
 Add to Chrome
 Add to Firefox
 Add to Edge