Mia Hubert
Cellwise and Casewise Robust Covariance in High Dimensions
May 26, 2025Abstract:The sample covariance matrix is a cornerstone of multivariate statistics, but it is highly sensitive to outliers. These can be casewise outliers, such as cases belonging to a different population, or cellwise outliers, which are deviating cells (entries) of the data matrix. Recently some robust covariance estimators have been developed that can handle both types of outliers, but their computation is only feasible up to at most 20 dimensions. To remedy this we propose the cellRCov method, a robust covariance estimator that simultaneously handles casewise outliers, cellwise outliers, and missing data. It relies on a decomposition of the covariance on principal and orthogonal subspaces, leveraging recent work on robust PCA. It also employs a ridge-type regularization to stabilize the estimated covariance matrix. We establish some theoretical properties of cellRCov, including its casewise and cellwise influence functions as well as consistency and asymptotic normality. A simulation study demonstrates the superior performance of cellRCov in contaminated and missing data scenarios. Furthermore, its practical utility is illustrated in a real-world application to anomaly detection. We also construct and illustrate the cellRCCA method for robust and regularized canonical correlation analysis.
Robust Multilinear Principal Component Analysis
Mar 10, 2025Abstract:Multilinear Principal Component Analysis (MPCA) is an important tool for analyzing tensor data. It performs dimension reduction similar to PCA for multivariate data. However, standard MPCA is sensitive to outliers. It is highly influenced by observations deviating from the bulk of the data, called casewise outliers, as well as by individual outlying cells in the tensors, so-called cellwise outliers. This latter type of outlier is highly likely to occur in tensor data, as tensors typically consist of many cells. This paper introduces a novel robust MPCA method that can handle both types of outliers simultaneously, and can cope with missing values as well. This method uses a single loss function to reduce the influence of both casewise and cellwise outliers. The solution that minimizes this loss function is computed using an iteratively reweighted least squares algorithm with a robust initialization. Graphical diagnostic tools are also proposed to identify the different types of outliers that have been found by the new robust MPCA method. The performance of the method and associated graphical displays is assessed through simulations and illustrated on two real datasets.
Outlier detection in non-elliptical data by kernel MRCD
Aug 05, 2020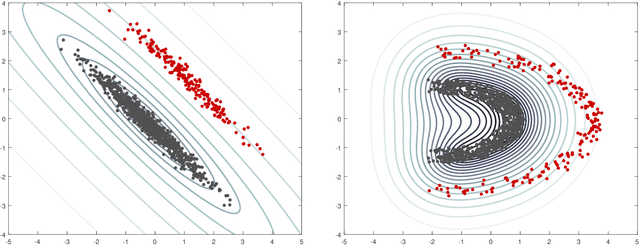
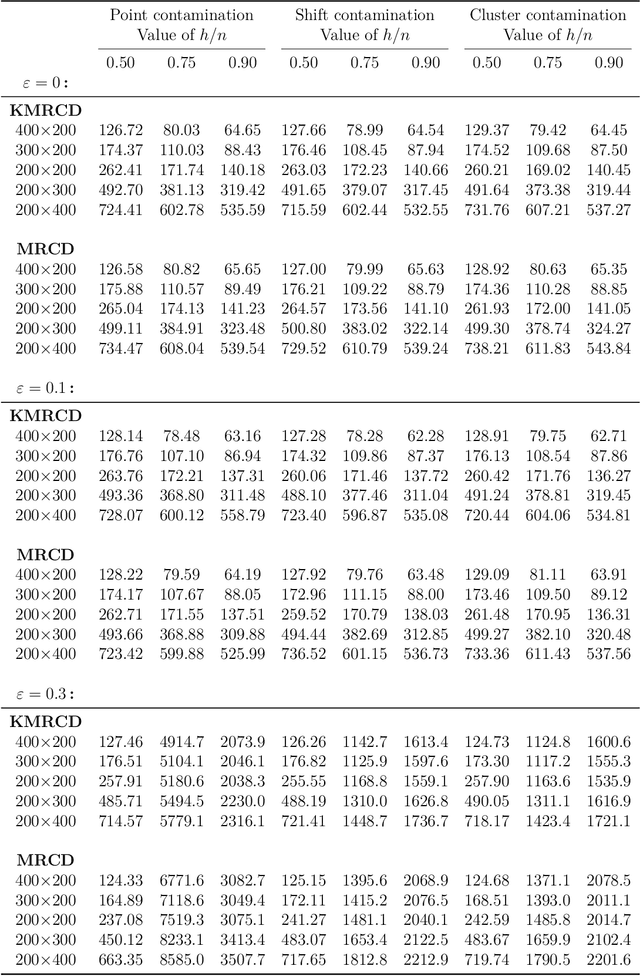
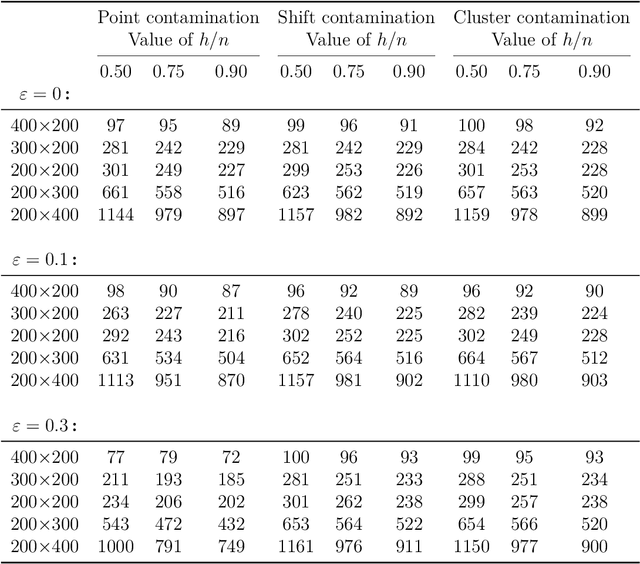
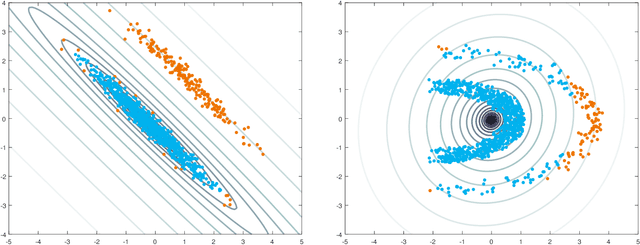
Abstract:The minimum regularized covariance determinant method (MRCD) is a robust estimator for multivariate location and scatter, which detects outliers by fitting a robust covariance matrix to the data. Its regularization ensures that the covariance matrix is well-conditioned in any dimension. The MRCD assumes that the non-outlying observations are roughly elliptically distributed, but many datasets are not of that form. Moreover, the computation time of MRCD increases substantially when the number of variables goes up, and nowadays datasets with many variables are common. The proposed Kernel Minimum Regularized Covariance Determinant (KMRCD) estimator addresses both issues. It is not restricted to elliptical data because it implicitly computes the MRCD estimates in a kernel induced feature space. A fast algorithm is constructed that starts from kernel-based initial estimates and exploits the kernel trick to speed up the subsequent computations. Based on the KMRCD estimates, a rule is proposed to flag outliers. The KMRCD algorithm performs well in simulations, and is illustrated on real-life data.
Visualizing classification results
Jul 28, 2020


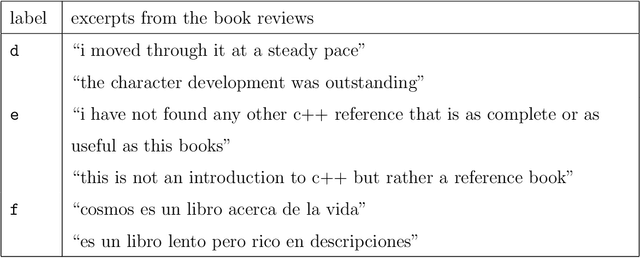
Abstract:Classification is a major tool of statistics and machine learning. A classification method first processes a training set of objects with given classes (labels), with the goal of afterward assigning new objects to one of these classes. When running the resulting prediction method on the training data or on test data, it can happen that an object is predicted to lie in a class that differs from its given label. This is sometimes called label bias, and raises the question whether the object was mislabeled.Our goal is to visualize aspects of the data classification to obtain insight. The proposed display reflects to what extent each object's label is (dis)similar to its prediction, how far each object lies from the other objects in its class, and whether some objects lie far from all classes. The display is constructed for discriminant analysis, the k-nearest neighbor classifier, support vector machines, logistic regression, and majority voting. It is illustrated on several benchmark datasets containing images and texts.
Anomaly Detection by Robust Statistics
Oct 14, 2017


Abstract:Real data often contain anomalous cases, also known as outliers. These may spoil the resulting analysis but they may also contain valuable information. In either case, the ability to detect such anomalies is essential. A useful tool for this purpose is robust statistics, which aims to detect the outliers by first fitting the majority of the data and then flagging data points that deviate from it. We present an overview of several robust methods and the resulting graphical outlier detection tools. We discuss robust procedures for univariate, low-dimensional, and high-dimensional data, such as estimating location and scatter, linear regression, principal component analysis, classification, clustering, and functional data analysis. Also the challenging new topic of cellwise outliers is introduced.
 Add to Chrome
 Add to Firefox
 Add to Edge