Ian Marius Peters
Introducing flexible perovskites to the IoT world using photovoltaic-powered wireless tags
Jul 01, 2022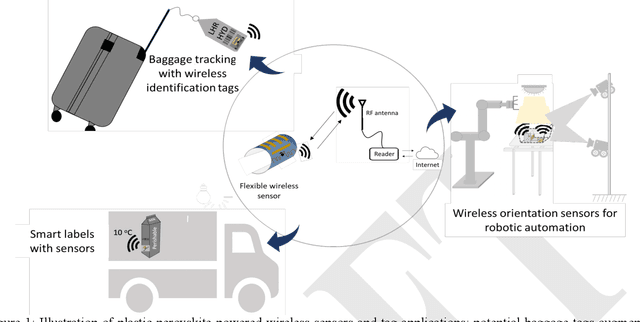
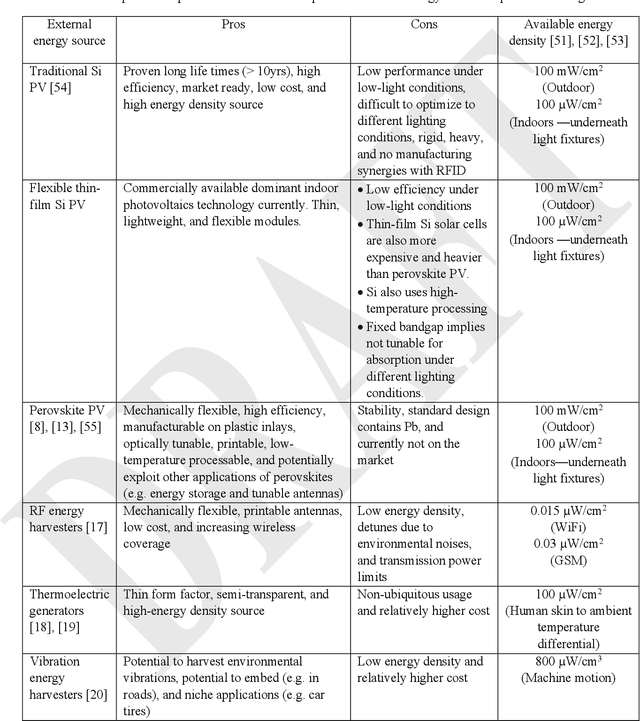
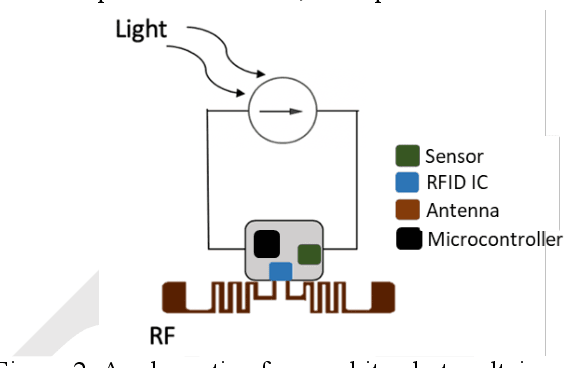
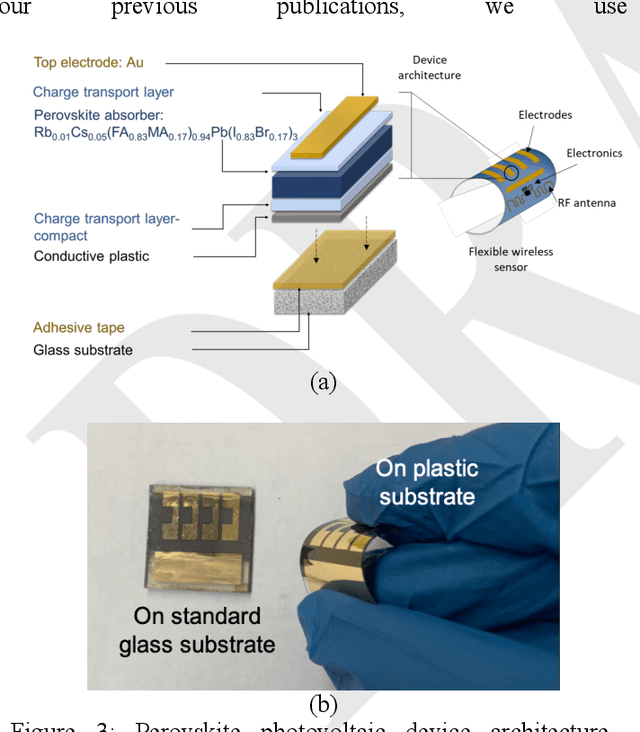
Abstract:Billions of everyday objects could become part of the Internet of Things (IoT) by augmentation with low-cost, long-range, maintenance-free wireless sensors. Radio Frequency Identification (RFID) is a low-cost wireless technology that could enable this vision, but it is constrained by short communication range and lack of sufficient energy available to power auxiliary electronics and sensors. Here, we explore the use of flexible perovskite photovoltaic cells to provide external power to semi-passive RFID tags to increase range and energy availability for external electronics such as microcontrollers and digital sensors. Perovskites are intriguing materials that hold the possibility to develop high-performance, low-cost, optically tunable (to absorb different light spectra), and flexible light energy harvesters. Our prototype perovskite photovoltaic cells on plastic substrates have an efficiency of 13% and a voltage of 0.88 V at maximum power under standard testing conditions. We built prototypes of RFID sensors powered with these flexible photovoltaic cells to demonstrate real-world applications. Our evaluation of the prototypes suggests that: i) flexible PV cells are durable up to a bending radius of 5 mm with only a 20 % drop in relative efficiency; ii) RFID communication range increased by 5x, and meets the energy needs (10-350 microwatt) to enable self-powered wireless sensors; iii) perovskite powered wireless sensors enable many battery-less sensing applications (e.g., perishable good monitoring, warehouse automation)
Georeferencing of Photovoltaic Modules from Aerial Infrared Videos using Structure-from-Motion
Apr 06, 2022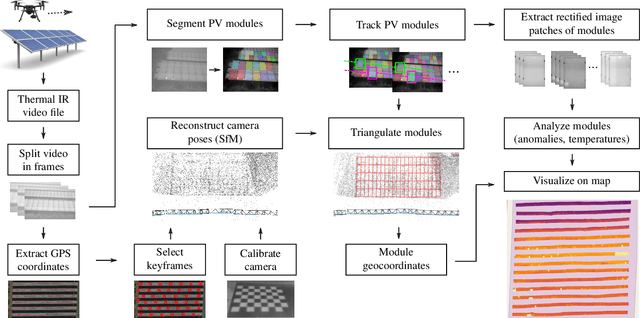

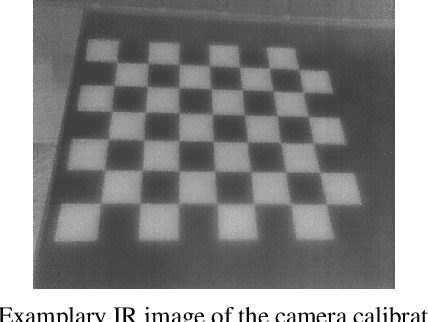
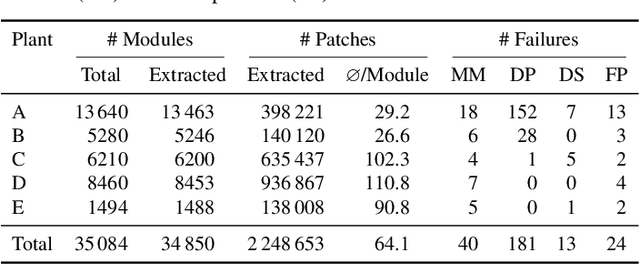
Abstract:To identify abnormal photovoltaic (PV) modules in large-scale PV plants economically, drone-mounted infrared (IR) cameras and automated video processing algorithms are frequently used. While most related works focus on the detection of abnormal modules, little has been done to automatically localize those modules within the plant. In this work, we use incremental structure-from-motion to automatically obtain geocoordinates of all PV modules in a plant based on visual cues and the measured GPS trajectory of the drone. In addition, we extract multiple IR images of each PV module. Using our method, we successfully map 99.3 % of the 35084 modules in four large-scale and one rooftop plant and extract over 2.2 million module images. As compared to our previous work, extraction misses 18 times less modules (one in 140 modules as compared to one in eight). Furthermore, two or three plant rows can be processed simultaneously, increasing module throughput and reducing flight duration by a factor of 2.1 and 3.7, respectively. Comparison with an accurate orthophoto of one of the large-scale plants yields a root mean square error of the estimated module geocoordinates of 5.87 m and a relative error within each plant row of 0.22 m to 0.82 m. Finally, we use the module geocoordinates and extracted IR images to visualize distributions of module temperatures and anomaly predictions of a deep learning classifier on a map. While the temperature distribution helps to identify disconnected strings, we also find that its detection accuracy for module anomalies reaches, or even exceeds, that of a deep learning classifier for seven out of ten common anomaly types. The software is published at https://github.com/LukasBommes/PV-Hawk.
Anomaly Detection in IR Images of PV Modules using Supervised Contrastive Learning
Dec 06, 2021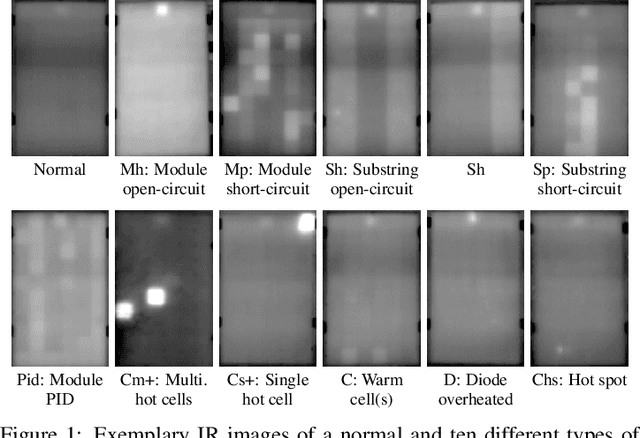

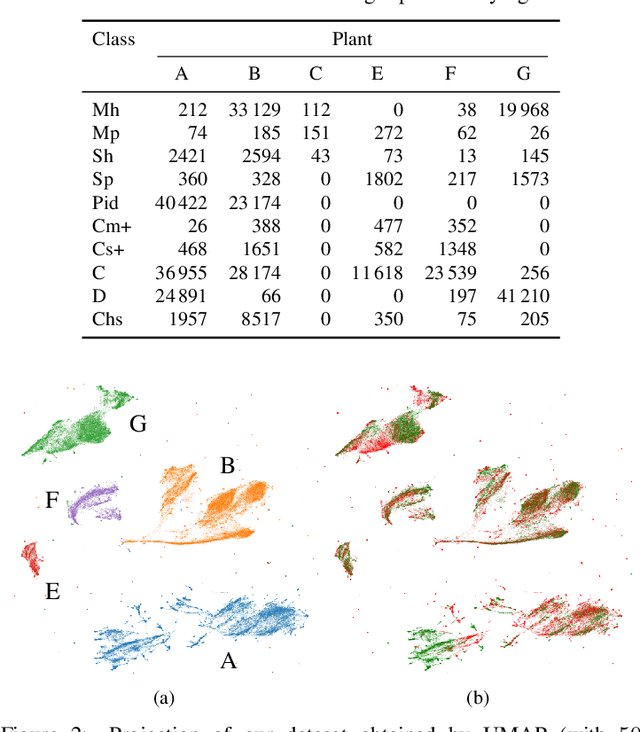
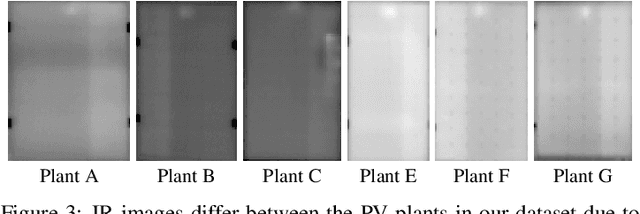
Abstract:Increasing deployment of photovoltaic (PV) plants requires methods for automatic detection of faulty PV modules in modalities, such as infrared (IR) images. Recently, deep learning has become popular for this. However, related works typically sample train and test data from the same distribution ignoring the presence of domain shift between data of different PV plants. Instead, we frame fault detection as more realistic unsupervised domain adaptation problem where we train on labelled data of one source PV plant and make predictions on another target plant. We train a ResNet-34 convolutional neural network with a supervised contrastive loss, on top of which we employ a k-nearest neighbor classifier to detect anomalies. Our method achieves a satisfactory area under the receiver operating characteristic (AUROC) of 73.3 % to 96.6 % on nine combinations of four source and target datasets with 2.92 million IR images of which 8.5 % are anomalous. It even outperforms a binary cross-entropy classifier in some cases. With a fixed decision threshold this results in 79.4 % and 77.1 % correctly classified normal and anomalous images, respectively. Most misclassified anomalies are of low severity, such as hot diodes and small hot spots. Our method is insensitive to hyperparameter settings, converges quickly and reliably detects unknown types of anomalies making it well suited for practice. Possible uses are in automatic PV plant inspection systems or to streamline manual labelling of IR datasets by filtering out normal images. Furthermore, our work serves the community with a more realistic view on PV module fault detection using unsupervised domain adaptation to develop more performant methods with favorable generalization capabilities.
Module-Power Prediction from PL Measurements using Deep Learning
Aug 31, 2021
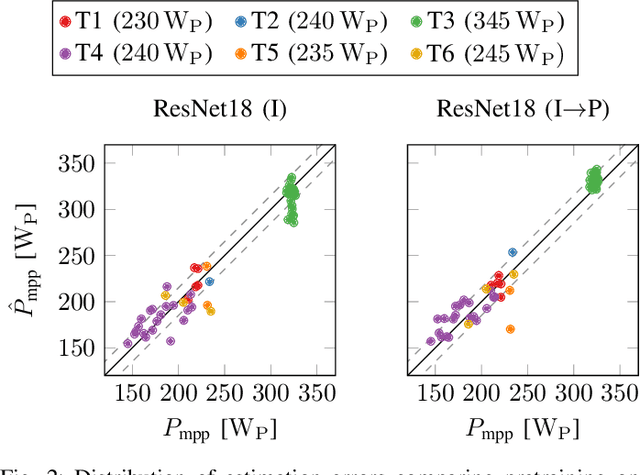
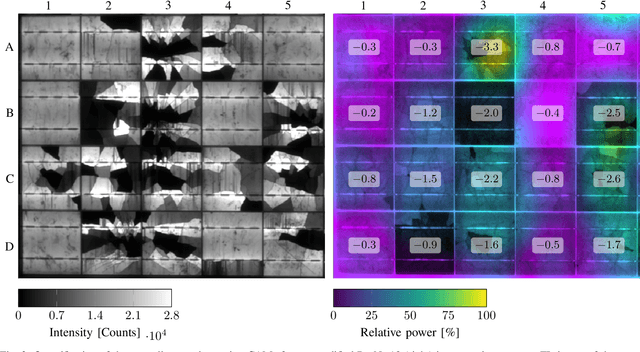

Abstract:The individual causes for power loss of photovoltaic modules are investigated for quite some time. Recently, it has been shown that the power loss of a module is, for example, related to the fraction of inactive areas. While these areas can be easily identified from electroluminescense (EL) images, this is much harder for photoluminescence (PL) images. With this work, we close the gap between power regression from EL and PL images. We apply a deep convolutional neural network to predict the module power from PL images with a mean absolute error (MAE) of 4.4% or 11.7WP. Furthermore, we depict that regression maps computed from the embeddings of the trained network can be used to compute the localized power loss. Finally, we show that these regression maps can be used to identify inactive regions in PL images as well.
Computer Vision Tool for Detection, Mapping and Fault Classification of PV Modules in Aerial IR Videos
Jun 14, 2021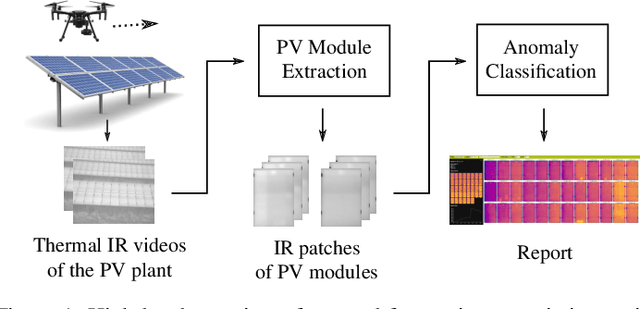
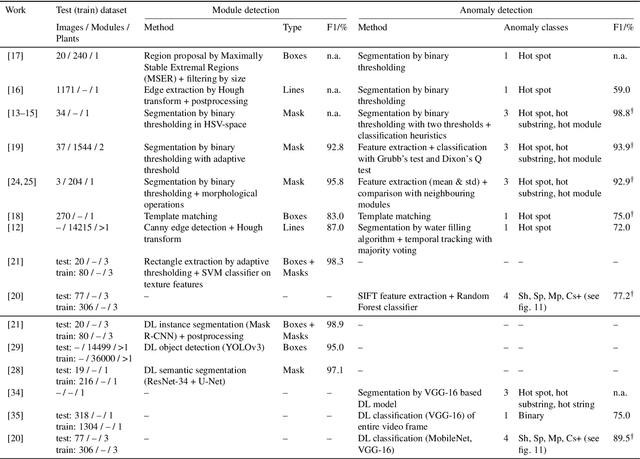

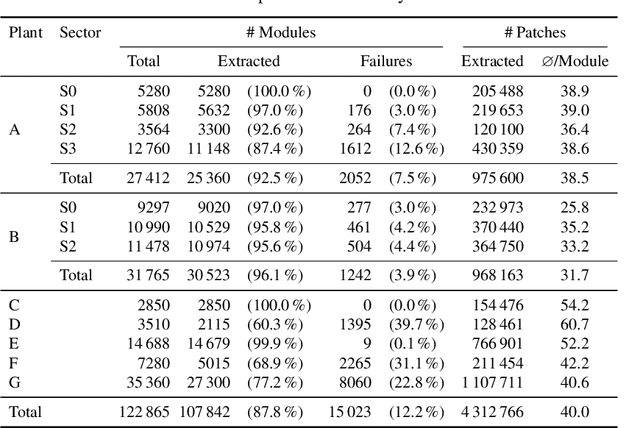
Abstract:Increasing deployment of photovoltaics (PV) plants demands for cheap and fast inspection. A viable tool for this task is thermographic imaging by unmanned aerial vehicles (UAV). In this work, we develop a computer vision tool for the semi-automatic extraction of PV modules from thermographic UAV videos. We use it to curate a dataset containing 4.3 million IR images of 107842 PV modules from thermographic videos of seven different PV plants. To demonstrate its use for automated PV plant inspection, we train a ResNet-50 to classify ten common module anomalies with more than 90 % test accuracy. Experiments show that our tool generalizes well to different PV plants. It successfully extracts PV modules from 512 out of 561 plant rows. Failures are mostly due to an inappropriate UAV trajectory and erroneous module segmentation. Including all manual steps our tool enables inspection of 3.5 MW p to 9 MW p of PV installations per day, potentially scaling to multi-gigawatt plants due to its parallel nature. While we present an effective method for automated PV plant inspection, we are also confident that our approach helps to meet the growing demand for large thermographic datasets for machine learning tasks, such as power prediction or unsupervised defect identification.
Joint Super-Resolution and Rectification for Solar Cell Inspection
Nov 10, 2020


Abstract:Visual inspection of solar modules is an important monitoring facility in photovoltaic power plants. Since a single measurement of fast CMOS sensors is limited in spatial resolution and often not sufficient to reliably detect small defects, we apply multi-frame super-resolution (MFSR) to a sequence of low resolution measurements. In addition, the rectification and removal of lens distortion simplifies subsequent analysis. Therefore, we propose to fuse this pre-processing with standard MFSR algorithms. This is advantageous, because we omit a separate processing step, the motion estimation becomes more stable and the spacing of high-resolution (HR) pixels on the rectified module image becomes uniform w.r.t. the module plane, regardless of perspective distortion. We present a comprehensive user study showing that MFSR is beneficial for defect recognition by human experts and that the proposed method performs better than the state of the art. Furthermore, we apply automated crack segmentation and show that the proposed method performs 3x better than bicubic upsampling and 2x better than the state of the art for automated inspection.
Deep Learning-based Pipeline for Module Power Prediction from EL Measurements
Sep 30, 2020

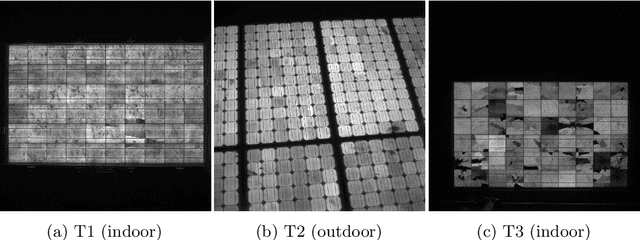

Abstract:Automated inspection plays an important role in monitoring large-scale photovoltaic power plants. Commonly, electroluminescense measurements are used to identify various types of defects on solar modules but have not been used to determine the power of a module. However, knowledge of the power at maximum power point is important as well, since drops in the power of a single module can affect the performance of an entire string. By now, this is commonly determined by measurements that require to discontact or even dismount the module, rendering a regular inspection of individual modules infeasible. In this work, we bridge the gap between electroluminescense measurements and the power determination of a module. We compile a large dataset of 719 electroluminescense measurementsof modules at various stages of degradation, especially cell cracks and fractures, and the corresponding power at maximum power point. Here,we focus on inactive regions and cracks as the predominant type of defect. We set up a baseline regression model to predict the power from electroluminescense measurements with a mean absolute error of 9.0+/-3.7W (4.0+/-8.4%). Then, we show that deep-learning can be used to train a model that performs significantly better (7.3+/-2.7W or 3.2+/-6.5%). With this work, we aim to open a new research topic. Therefore, we publicly release the dataset, the code and trained models to empower other researchers to compare against our results. Finally, we present a thorough evaluation of certain boundary conditions like the dataset size and an automated preprocessing pipeline for on-site measurements showing multiple modules at once.
 Add to Chrome
 Add to Firefox
 Add to Edge