David Martens
On the Definition and Detection of Cherry-Picking in Counterfactual Explanations
Jan 08, 2026Abstract:Counterfactual explanations are widely used to communicate how inputs must change for a model to alter its prediction. For a single instance, many valid counterfactuals can exist, which leaves open the possibility for an explanation provider to cherry-pick explanations that better suit a narrative of their choice, highlighting favourable behaviour and withholding examples that reveal problematic behaviour. We formally define cherry-picking for counterfactual explanations in terms of an admissible explanation space, specified by the generation procedure, and a utility function. We then study to what extent an external auditor can detect such manipulation. Considering three levels of access to the explanation process: full procedural access, partial procedural access, and explanation-only access, we show that detection is extremely limited in practice. Even with full procedural access, cherry-picked explanations can remain difficult to distinguish from non cherry-picked explanations, because the multiplicity of valid counterfactuals and flexibility in the explanation specification provide sufficient degrees of freedom to mask deliberate selection. Empirically, we demonstrate that this variability often exceeds the effect of cherry-picking on standard counterfactual quality metrics such as proximity, plausibility, and sparsity, making cherry-picked explanations statistically indistinguishable from baseline explanations. We argue that safeguards should therefore prioritise reproducibility, standardisation, and procedural constraints over post-hoc detection, and we provide recommendations for algorithm developers, explanation providers, and auditors.
From What Ifs to Insights: Counterfactuals in Causal Inference vs. Explainable AI
May 19, 2025Abstract:Counterfactuals play a pivotal role in the two distinct data science fields of causal inference (CI) and explainable artificial intelligence (XAI). While the core idea behind counterfactuals remains the same in both fields--the examination of what would have happened under different circumstances--there are key differences in how they are used and interpreted. We introduce a formal definition that encompasses the multi-faceted concept of the counterfactual in CI and XAI. We then discuss how counterfactuals are used, evaluated, generated, and operationalized in CI vs. XAI, highlighting conceptual and practical differences. By comparing and contrasting the two, we hope to identify opportunities for cross-fertilization across CI and XAI.
Exploring the generalization of LLM truth directions on conversational formats
May 14, 2025Abstract:Several recent works argue that LLMs have a universal truth direction where true and false statements are linearly separable in the activation space of the model. It has been demonstrated that linear probes trained on a single hidden state of the model already generalize across a range of topics and might even be used for lie detection in LLM conversations. In this work we explore how this truth direction generalizes between various conversational formats. We find good generalization between short conversations that end on a lie, but poor generalization to longer formats where the lie appears earlier in the input prompt. We propose a solution that significantly improves this type of generalization by adding a fixed key phrase at the end of each conversation. Our results highlight the challenges towards reliable LLM lie detectors that generalize to new settings.
Beware of "Explanations" of AI
Apr 09, 2025Abstract:Understanding the decisions made and actions taken by increasingly complex AI system remains a key challenge. This has led to an expanding field of research in explainable artificial intelligence (XAI), highlighting the potential of explanations to enhance trust, support adoption, and meet regulatory standards. However, the question of what constitutes a "good" explanation is dependent on the goals, stakeholders, and context. At a high level, psychological insights such as the concept of mental model alignment can offer guidance, but success in practice is challenging due to social and technical factors. As a result of this ill-defined nature of the problem, explanations can be of poor quality (e.g. unfaithful, irrelevant, or incoherent), potentially leading to substantial risks. Instead of fostering trust and safety, poorly designed explanations can actually cause harm, including wrong decisions, privacy violations, manipulation, and even reduced AI adoption. Therefore, we caution stakeholders to beware of explanations of AI: while they can be vital, they are not automatically a remedy for transparency or responsible AI adoption, and their misuse or limitations can exacerbate harm. Attention to these caveats can help guide future research to improve the quality and impact of AI explanations.
How good is my story? Towards quantitative metrics for evaluating LLM-generated XAI narratives
Dec 13, 2024Abstract:A rapidly developing application of LLMs in XAI is to convert quantitative explanations such as SHAP into user-friendly narratives to explain the decisions made by smaller prediction models. Evaluating the narratives without relying on human preference studies or surveys is becoming increasingly important in this field. In this work we propose a framework and explore several automated metrics to evaluate LLM-generated narratives for explanations of tabular classification tasks. We apply our approach to compare several state-of-the-art LLMs across different datasets and prompt types. As a demonstration of their utility, these metrics allow us to identify new challenges related to LLM hallucinations for XAI narratives.
GraphXAIN: Narratives to Explain Graph Neural Networks
Nov 04, 2024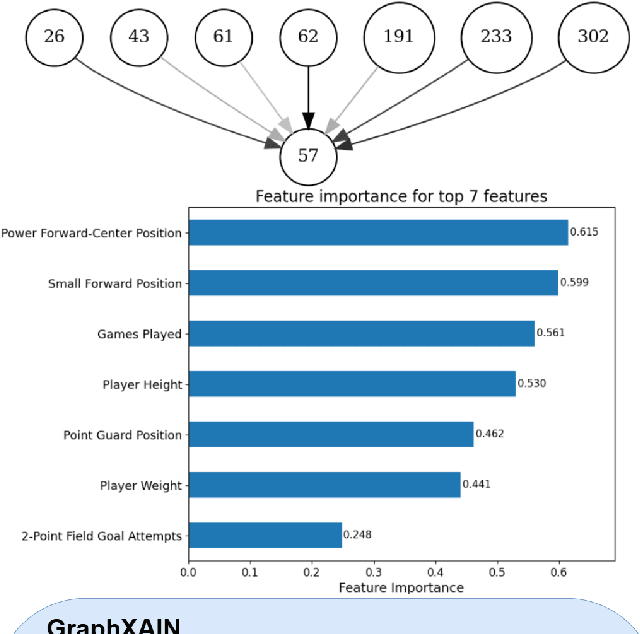
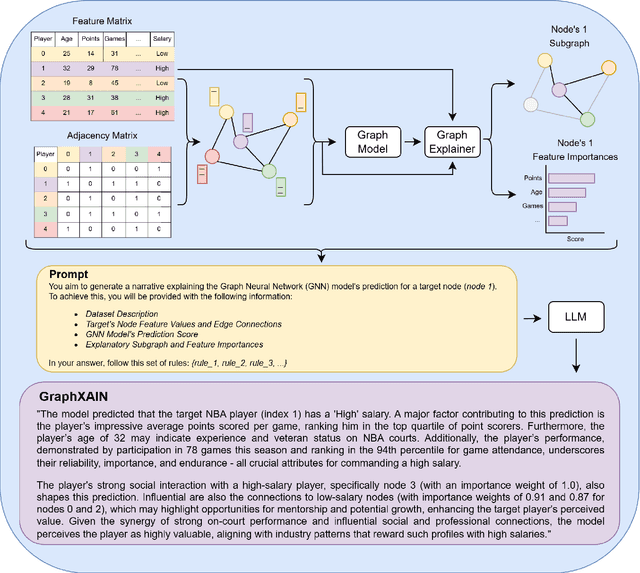
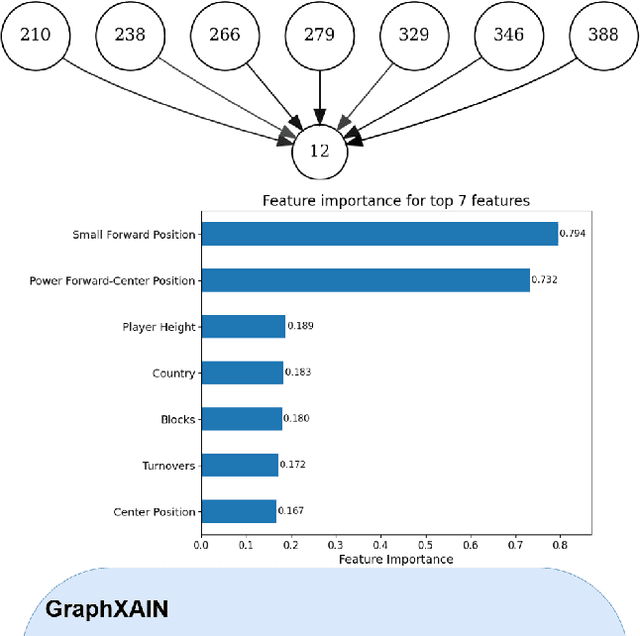
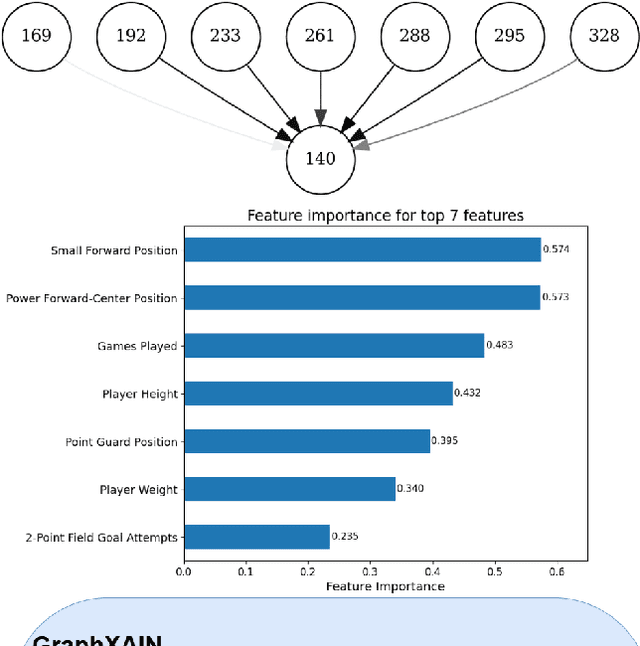
Abstract:Graph Neural Networks (GNNs) are a powerful technique for machine learning on graph-structured data, yet they pose interpretability challenges, especially for non-expert users. Existing GNN explanation methods often yield technical outputs such as subgraphs and feature importance scores, which are not easily understood. Building on recent insights from social science and other Explainable AI (XAI) methods, we propose GraphXAIN, a natural language narrative that explains individual predictions made by GNNs. We present a model-agnostic and explainer-agnostic XAI approach that complements graph explainers by generating GraphXAINs, using Large Language Models (LLMs) and integrating graph data, individual predictions from GNNs, explanatory subgraphs, and feature importances. We define XAI Narratives and XAI Descriptions, highlighting their distinctions and emphasizing the importance of narrative principles in effective explanations. By incorporating natural language narratives, our approach supports graph practitioners and non-expert users, aligning with social science research on explainability and enhancing user understanding and trust in complex GNN models. We demonstrate GraphXAIN's capabilities on a real-world graph dataset, illustrating how its generated narratives can aid understanding compared to traditional graph explainer outputs or other descriptive explanation methods.
Exposing Image Classifier Shortcuts with Counterfactual Frequency (CoF) Tables
May 24, 2024Abstract:The rise of deep learning in image classification has brought unprecedented accuracy but also highlighted a key issue: the use of 'shortcuts' by models. Such shortcuts are easy-to-learn patterns from the training data that fail to generalise to new data. Examples include the use of a copyright watermark to recognise horses, snowy background to recognise huskies, or ink markings to detect malignant skin lesions. The explainable AI (XAI) community has suggested using instance-level explanations to detect shortcuts without external data, but this requires the examination of many explanations to confirm the presence of such shortcuts, making it a labour-intensive process. To address these challenges, we introduce Counterfactual Frequency (CoF) tables, a novel approach that aggregates instance-based explanations into global insights, and exposes shortcuts. The aggregation implies the need for some semantic concepts to be used in the explanations, which we solve by labelling the segments of an image. We demonstrate the utility of CoF tables across several datasets, revealing the shortcuts learned from them.
Beyond Accuracy-Fairness: Stop evaluating bias mitigation methods solely on between-group metrics
Jan 24, 2024


Abstract:Artificial Intelligence (AI) finds widespread applications across various domains, sparking concerns about fairness in its deployment. While fairness in AI remains a central concern, the prevailing discourse often emphasizes outcome-based metrics without a nuanced consideration of the differential impacts within subgroups. Bias mitigation techniques do not only affect the ranking of pairs of instances across sensitive groups, but often also significantly affect the ranking of instances within these groups. Such changes are hard to explain and raise concerns regarding the validity of the intervention. Unfortunately, these effects largely remain under the radar in the accuracy-fairness evaluation framework that is usually applied. This paper challenges the prevailing metrics for assessing bias mitigation techniques, arguing that they do not take into account the changes within-groups and that the resulting prediction labels fall short of reflecting real-world scenarios. We propose a paradigm shift: initially, we should focus on generating the most precise ranking for each subgroup. Following this, individuals should be chosen from these rankings to meet both fairness standards and practical considerations.
Tell Me a Story! Narrative-Driven XAI with Large Language Models
Sep 29, 2023Abstract:In today's critical domains, the predominance of black-box machine learning models amplifies the demand for Explainable AI (XAI). The widely used SHAP values, while quantifying feature importance, are often too intricate and lack human-friendly explanations. Furthermore, counterfactual (CF) explanations present `what ifs' but leave users grappling with the 'why'. To bridge this gap, we introduce XAIstories. Leveraging Large Language Models, XAIstories provide narratives that shed light on AI predictions: SHAPstories do so based on SHAP explanations to explain a prediction score, while CFstories do so for CF explanations to explain a decision. Our results are striking: over 90% of the surveyed general audience finds the narrative generated by SHAPstories convincing. Data scientists primarily see the value of SHAPstories in communicating explanations to a general audience, with 92% of data scientists indicating that it will contribute to the ease and confidence of nonspecialists in understanding AI predictions. Additionally, 83% of data scientists indicate they are likely to use SHAPstories for this purpose. In image classification, CFstories are considered more or equally convincing as users own crafted stories by over 75% of lay user participants. CFstories also bring a tenfold speed gain in creating a narrative, and improves accuracy by over 20% compared to manually created narratives. The results thereby suggest that XAIstories may provide the missing link in truly explaining and understanding AI predictions.
Manipulation Risks in Explainable AI: The Implications of the Disagreement Problem
Jun 27, 2023
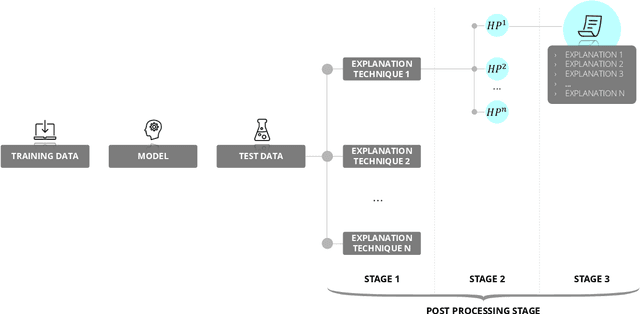

Abstract:Artificial Intelligence (AI) systems are increasingly used in high-stakes domains of our life, increasing the need to explain these decisions and to make sure that they are aligned with how we want the decision to be made. The field of Explainable AI (XAI) has emerged in response. However, it faces a significant challenge known as the disagreement problem, where multiple explanations are possible for the same AI decision or prediction. While the existence of the disagreement problem is acknowledged, the potential implications associated with this problem have not yet been widely studied. First, we provide an overview of the different strategies explanation providers could deploy to adapt the returned explanation to their benefit. We make a distinction between strategies that attack the machine learning model or underlying data to influence the explanations, and strategies that leverage the explanation phase directly. Next, we analyse several objectives and concrete scenarios the providers could have to engage in this behavior, and the potential dangerous consequences this manipulative behavior could have on society. We emphasize that it is crucial to investigate this issue now, before these methods are widely implemented, and propose some mitigation strategies.
 Add to Chrome
 Add to Firefox
 Add to Edge