Bo Thiesson
The Consequences of the Framing of Machine Learning Risk Prediction Models: Evaluation of Sepsis in General Wards
Jan 26, 2021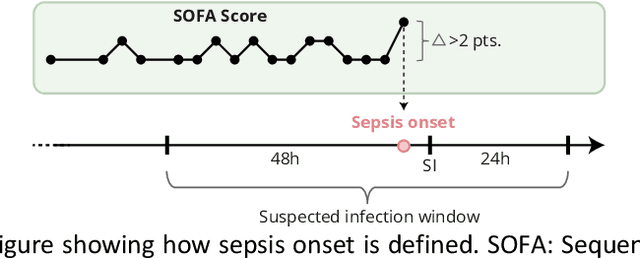

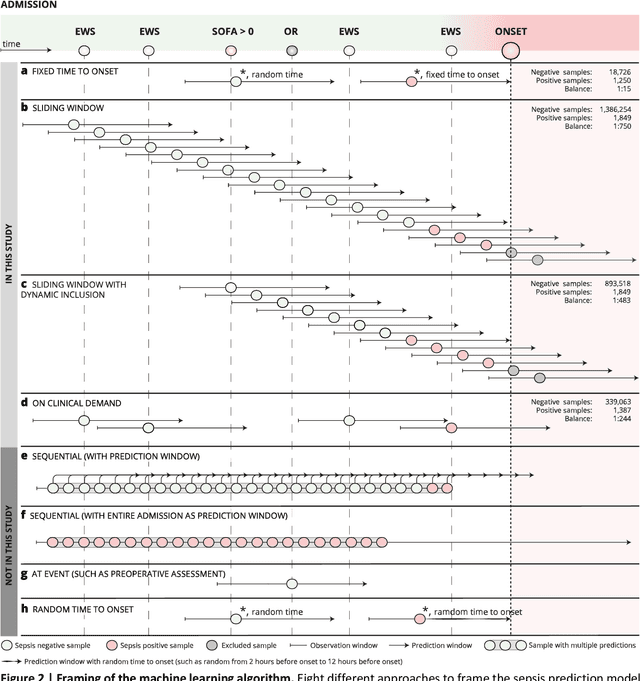

Abstract:Objectives: To evaluate the consequences of the framing of machine learning risk prediction models. We evaluate how framing affects model performance and model learning in four different approaches previously applied in published artificial-intelligence (AI) models. Setting and participants: We analysed structured secondary healthcare data from 221,283 citizens from four Danish municipalities who were 18 years of age or older. Results: The four models had similar population level performance (a mean area under the receiver operating characteristic curve of 0.73 to 0.82), in contrast to the mean average precision, which varied greatly from 0.007 to 0.385. Correspondingly, the percentage of missing values also varied between framing approaches. The on-clinical-demand framing, which involved samples for each time the clinicians made an early warning score assessment, showed the lowest percentage of missing values among the vital sign parameters, and this model was also able to learn more temporal dependencies than the others. The Shapley additive explanations demonstrated opposing interpretations of SpO2 in the prediction of sepsis as a consequence of differentially framed models. Conclusions: The profound consequences of framing mandate attention from clinicians and AI developers, as the understanding and reporting of framing are pivotal to the successful development and clinical implementation of future AI technology. Model framing must reflect the expected clinical environment. The importance of proper problem framing is by no means exclusive to sepsis prediction and applies to most clinical risk prediction models.
Explainable artificial intelligence model to predict acute critical illness from electronic health records
Dec 03, 2019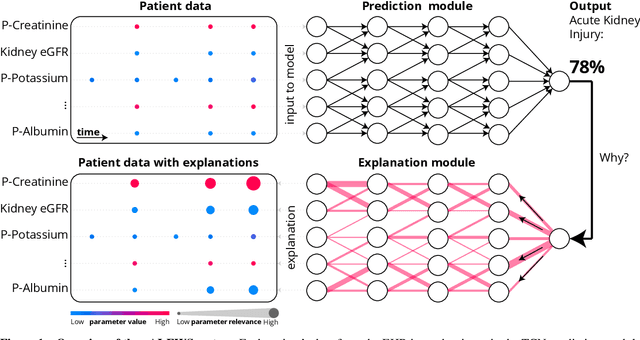
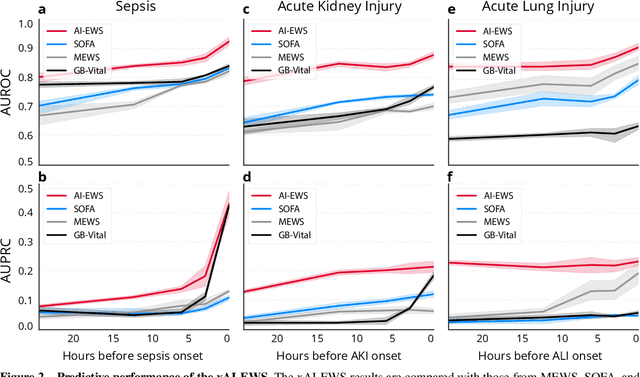
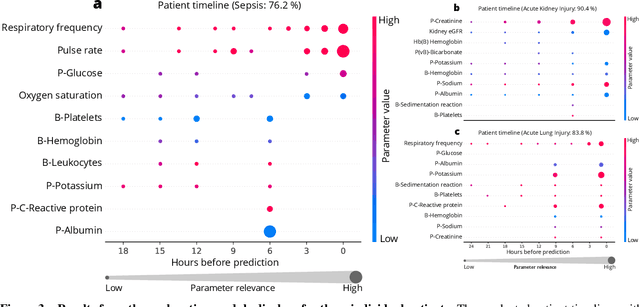
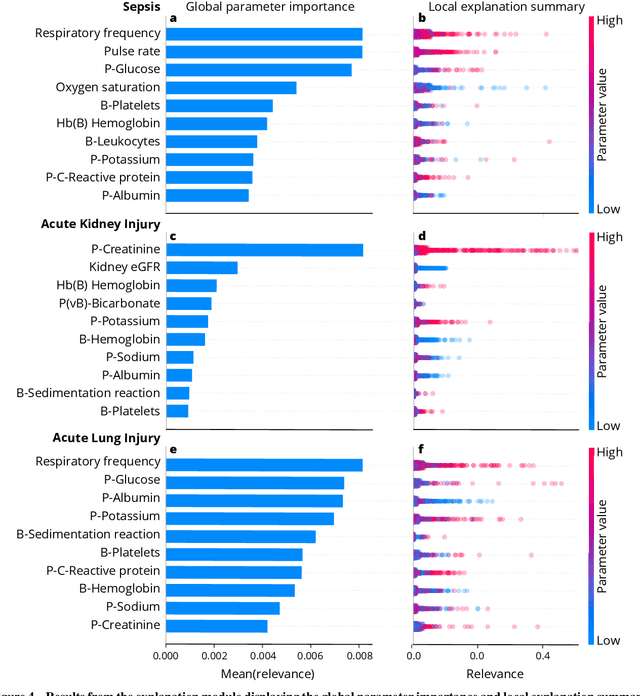
Abstract:We developed an explainable artificial intelligence (AI) early warning score (xAI-EWS) system for early detection of acute critical illness. While maintaining a high predictive performance, our system explains to the clinician on which relevant electronic health records (EHRs) data the prediction is grounded. Acute critical illness is often preceded by deterioration of routinely measured clinical parameters, e.g., blood pressure and heart rate. Early clinical prediction is typically based on manually calculated screening metrics that simply weigh these parameters, such as Early Warning Scores (EWS). The predictive performance of EWSs yields a tradeoff between sensitivity and specificity that can lead to negative outcomes for the patient. Previous work on EHR-trained AI systems offers promising results with high levels of predictive performance in relation to the early, real-time prediction of acute critical illness. However, without insight into the complex decisions by such system, clinical translation is hindered. In this letter, we present our xAI-EWS system, which potentiates clinical translation by accompanying a prediction with information on the EHR data explaining it.
Early detection of sepsis utilizing deep learning on electronic health record event sequences
Jun 07, 2019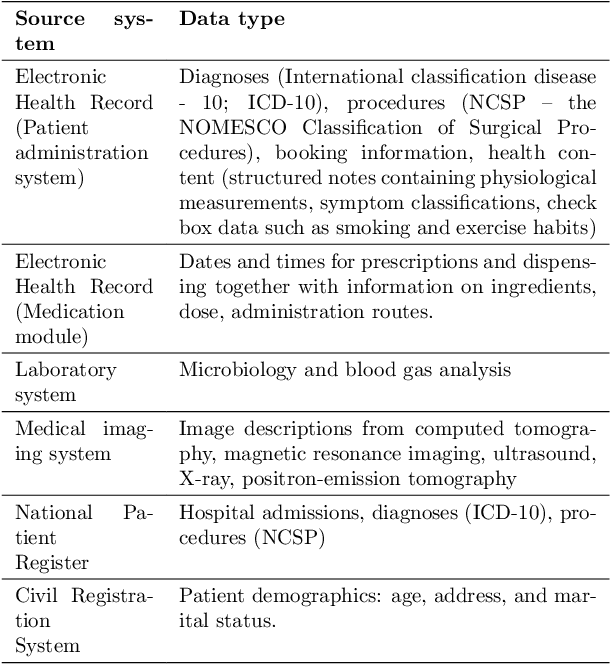
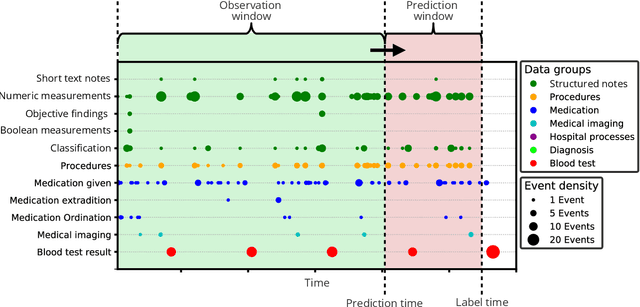
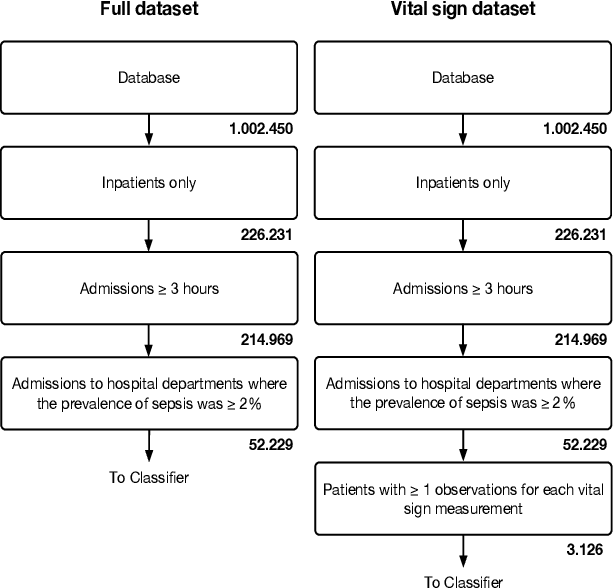
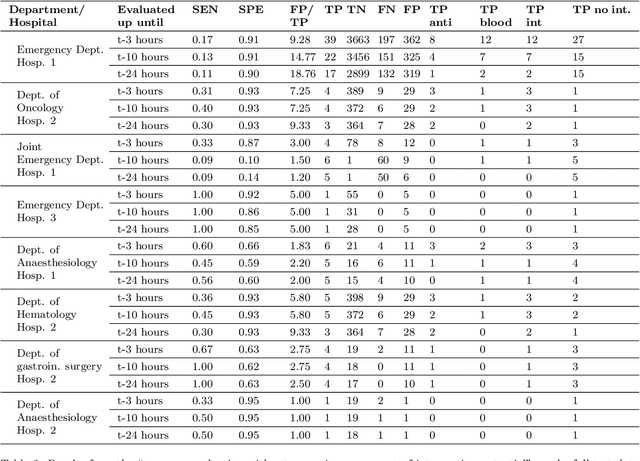
Abstract:The timeliness of detection of a sepsis event in progress is a crucial factor in the outcome for the patient. Machine learning models built from data in electronic health records can be used as an effective tool for improving this timeliness, but so far the potential for clinical implementations has been largely limited to studies in intensive care units. This study will employ a richer data set that will expand the applicability of these models beyond intensive care units. Furthermore, we will circumvent several important limitations that have been found in the literature: 1) Models are evaluated shortly before sepsis onset without considering interventions already initiated. 2) Machine learning models are built on a restricted set of clinical parameters, which are not necessarily measured in all departments. 3) Model performance is limited by current knowledge of sepsis, as feature interactions and time dependencies are hardcoded into the model. In this study, we present a model to overcome these shortcomings using a deep learning approach on a diverse multicenter data set. We used retrospective data from multiple Danish hospitals over a seven-year period. Our sepsis detection system is constructed as a combination of a convolutional neural network and a long short-term memory network. We suggest a retrospective assessment of interventions by looking at intravenous antibiotics and blood cultures preceding the prediction time. Results show performance ranging from AUROC 0.856 (3 hours before sepsis onset) to AUROC 0.756 (24 hours before sepsis onset). We present a deep learning system for early detection of sepsis that is able to learn characteristics of the key factors and interactions from the raw event sequence data itself, without relying on a labor-intensive feature extraction work.
Utilizing Device-level Demand Forecasting for Flexibility Markets - Full Version
May 02, 2018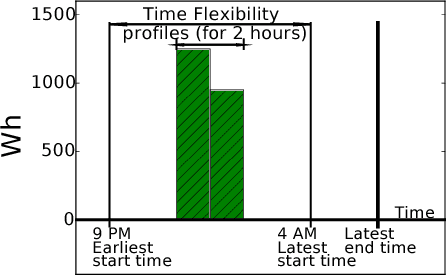

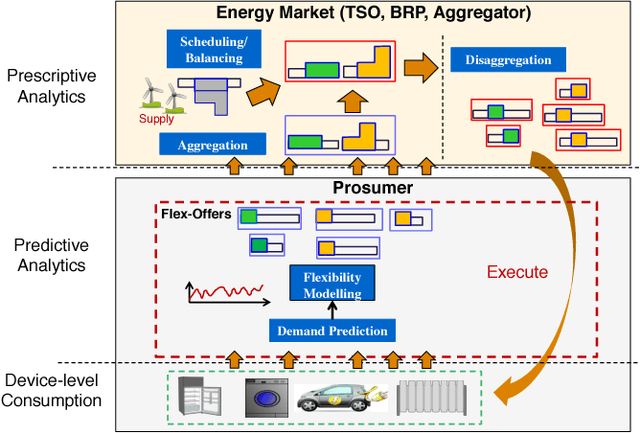

Abstract:The uncertainty in the power supply due to fluctuating Renewable Energy Sources (RES) has severe (financial and other) implications for energy market players. In this paper, we present a device-level Demand Response (DR) scheme that captures the atomic (all available) flexibilities in energy demand and provides the largest possible solution space to generate demand/supply schedules that minimize market imbalances. We evaluate the effectiveness and feasibility of widely used forecasting models for device-level flexibility analysis. In a typical device-level flexibility forecast, a market player is more concerned with the \textit{utility} that the demand flexibility brings to the market, rather than the intrinsic forecast accuracy. In this regard, we provide comprehensive predictive modeling and scheduling of demand flexibility from household appliances to demonstrate the (financial and otherwise) viability of introducing flexibility-based DR in the Danish/Nordic market. Further, we investigate the correlation between the potential utility and the accuracy of the demand forecast model. Furthermore, we perform a number of experiments to determine the data granularity that provides the best financial reward to market players for adopting the proposed DR scheme. A cost-benefit analysis of forecast results shows that even with somewhat low forecast accuracy, market players can achieve regulation cost savings of 54% of the theoretically optimal.
Learning Mixtures of DAG Models
May 16, 2015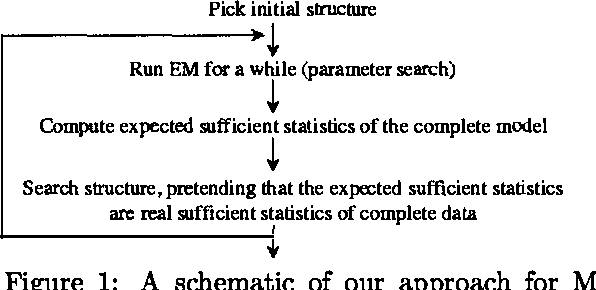
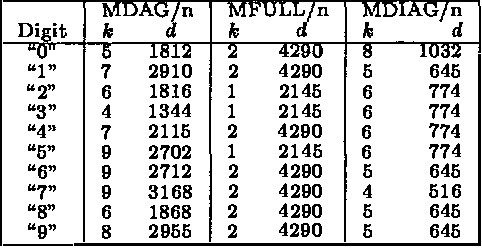
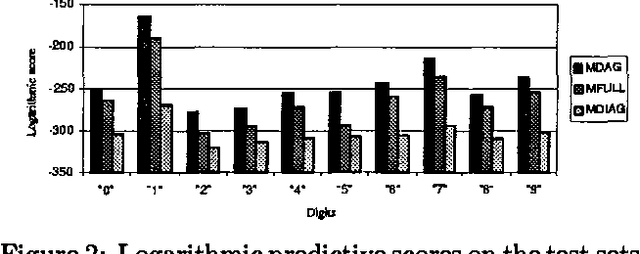

Abstract:We describe computationally efficient methods for learning mixtures in which each component is a directed acyclic graphical model (mixtures of DAGs or MDAGs). We argue that simple search-and-score algorithms are infeasible for a variety of problems, and introduce a feasible approach in which parameter and structure search is interleaved and expected data is treated as real data. Our approach can be viewed as a combination of (1) the Cheeseman--Stutz asymptotic approximation for model posterior probability and (2) the Expectation--Maximization algorithm. We evaluate our procedure for selecting among MDAGs on synthetic and real examples.
The Bregman Variational Dual-Tree Framework
Sep 26, 2013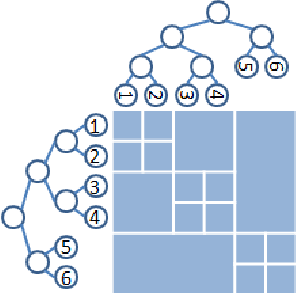


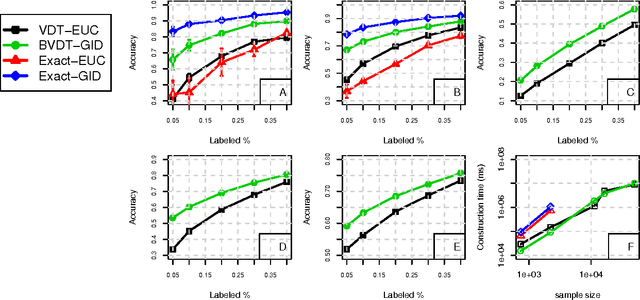
Abstract:Graph-based methods provide a powerful tool set for many non-parametric frameworks in Machine Learning. In general, the memory and computational complexity of these methods is quadratic in the number of examples in the data which makes them quickly infeasible for moderate to large scale datasets. A significant effort to find more efficient solutions to the problem has been made in the literature. One of the state-of-the-art methods that has been recently introduced is the Variational Dual-Tree (VDT) framework. Despite some of its unique features, VDT is currently restricted only to Euclidean spaces where the Euclidean distance quantifies the similarity. In this paper, we extend the VDT framework beyond the Euclidean distance to more general Bregman divergences that include the Euclidean distance as a special case. By exploiting the properties of the general Bregman divergence, we show how the new framework can maintain all the pivotal features of the VDT framework and yet significantly improve its performance in non-Euclidean domains. We apply the proposed framework to different text categorization problems and demonstrate its benefits over the original VDT.
Score and Information for Recursive Exponential Models with Incomplete Data
Feb 06, 2013
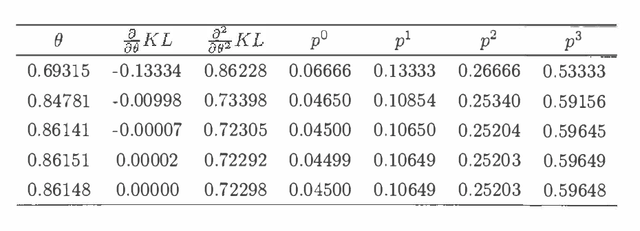
Abstract:Recursive graphical models usually underlie the statistical modelling concerning probabilistic expert systems based on Bayesian networks. This paper defines a version of these models, denoted as recursive exponential models, which have evolved by the desire to impose sophisticated domain knowledge onto local fragments of a model. Besides the structural knowledge, as specified by a given model, the statistical modelling may also include expert opinion about the values of parameters in the model. It is shown how to translate imprecise expert knowledge into approximately conjugate prior distributions. Based on possibly incomplete data, the score and the observed information are derived for these models. This accounts for both the traditional score and observed information, derived as derivatives of the log-likelihood, and the posterior score and observed information, derived as derivatives of the log-posterior distribution. Throughout the paper the specialization into recursive graphical models is accounted for by a simple example.
Staged Mixture Modelling and Boosting
Dec 12, 2012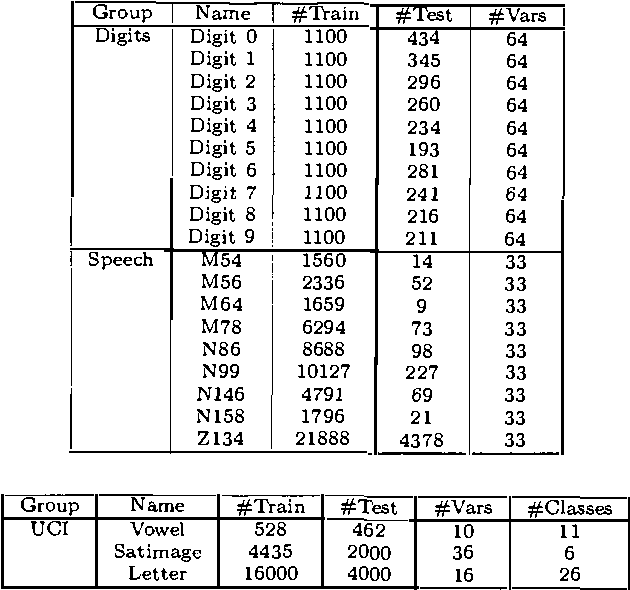
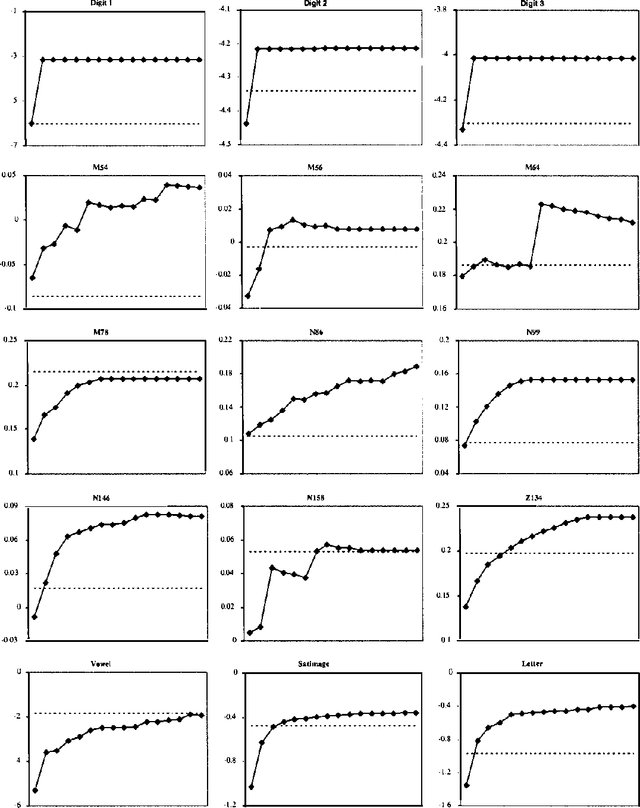

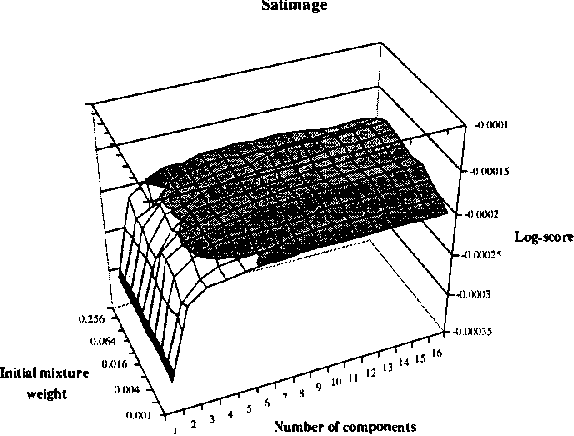
Abstract:In this paper, we introduce and evaluate a data-driven staged mixture modeling technique for building density, regression, and classification models. Our basic approach is to sequentially add components to a finite mixture model using the structural expectation maximization (SEM) algorithm. We show that our technique is qualitatively similar to boosting. This correspondence is a natural byproduct of the fact that we use the SEM algorithm to sequentially fit the mixture model. Finally, in our experimental evaluation, we demonstrate the effectiveness of our approach on a variety of prediction and density estimation tasks using real-world data.
Variational Dual-Tree Framework for Large-Scale Transition Matrix Approximation
Oct 16, 2012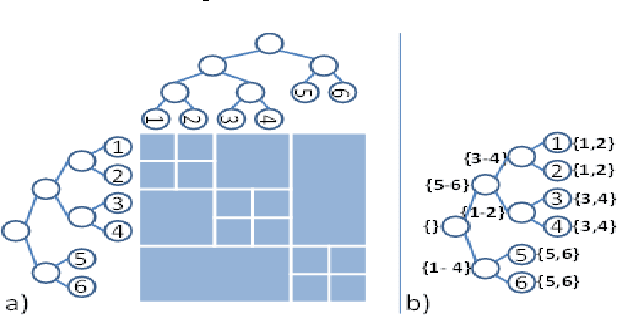

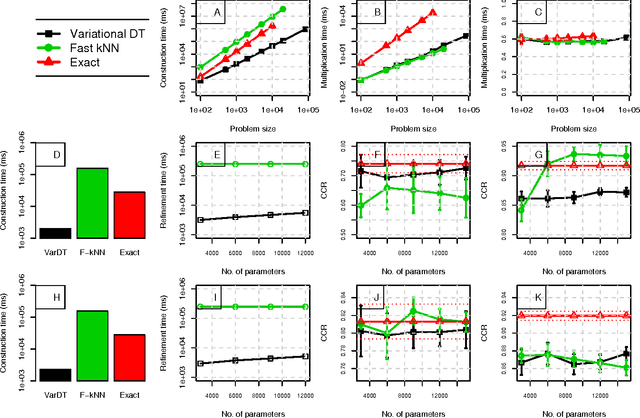

Abstract:In recent years, non-parametric methods utilizing random walks on graphs have been used to solve a wide range of machine learning problems, but in their simplest form they do not scale well due to the quadratic complexity. In this paper, a new dual-tree based variational approach for approximating the transition matrix and efficiently performing the random walk is proposed. The approach exploits a connection between kernel density estimation, mixture modeling, and random walk on graphs in an optimization of the transition matrix for the data graph that ties together edge transitions probabilities that are similar. Compared to the de facto standard approximation method based on k-nearestneighbors, we demonstrate order of magnitudes speedup without sacrificing accuracy for Label Propagation tasks on benchmark data sets in semi-supervised learning.
ARMA Time-Series Modeling with Graphical Models
Aug 08, 2012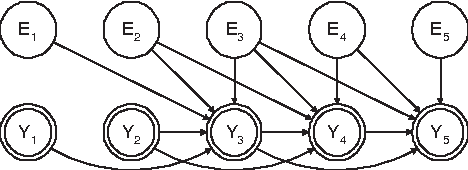
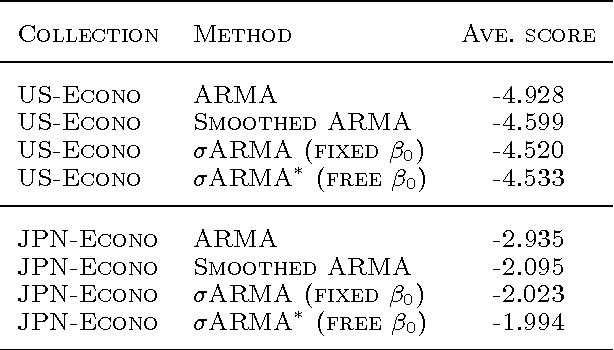
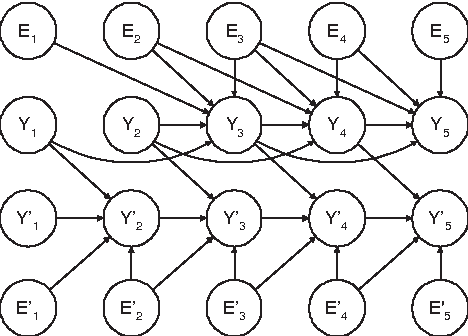
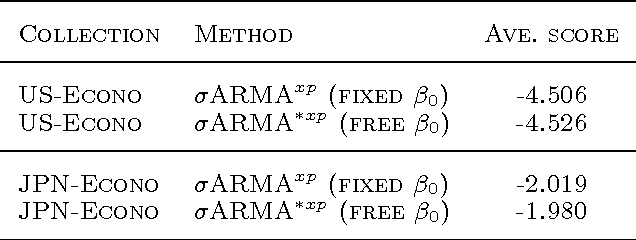
Abstract:We express the classic ARMA time-series model as a directed graphical model. In doing so, we find that the deterministic relationships in the model make it effectively impossible to use the EM algorithm for learning model parameters. To remedy this problem, we replace the deterministic relationships with Gaussian distributions having a small variance, yielding the stochastic ARMA (ARMA) model. This modification allows us to use the EM algorithm to learn parmeters and to forecast,even in situations where some data is missing. This modification, in conjunction with the graphicalmodel approach, also allows us to include cross predictors in situations where there are multiple times series and/or additional nontemporal covariates. More surprising,experiments suggest that the move to stochastic ARMA yields improved accuracy through better smoothing. We demonstrate improvements afforded by cross prediction and better smoothing on real data.
 Add to Chrome
 Add to Firefox
 Add to Edge