 Add to Chrome
 Add to Firefox
 Add to Edge
Efficient and Effective Implicit Dynamic Graph Neural Network
Jun 25, 2024


Implicit graph neural networks have gained popularity in recent years as they capture long-range dependencies while improving predictive performance in static graphs. Despite the tussle between performance degradation due to the oversmoothing of learned embeddings and long-range dependency being more pronounced in dynamic graphs, as features are aggregated both across neighborhood and time, no prior work has proposed an implicit graph neural model in a dynamic setting. In this paper, we present Implicit Dynamic Graph Neural Network (IDGNN) a novel implicit neural network for dynamic graphs which is the first of its kind. A key characteristic of IDGNN is that it demonstrably is well-posed, i.e., it is theoretically guaranteed to have a fixed-point representation. We then demonstrate that the standard iterative algorithm often used to train implicit models is computationally expensive in our dynamic setting as it involves computing gradients, which themselves have to be estimated in an iterative manner. To overcome this, we pose an equivalent bilevel optimization problem and propose an efficient single-loop training algorithm that avoids iterative computation by maintaining moving averages of key components of the gradients. We conduct extensive experiments on real-world datasets on both classification and regression tasks to demonstrate the superiority of our approach over the state-of-the-art baselines. We also demonstrate that our bi-level optimization framework maintains the performance of the expensive iterative algorithm while obtaining up to \textbf{1600x} speed-up.
Dynamic Healthcare Embeddings for Improving Patient Care
Mar 21, 2023As hospitals move towards automating and integrating their computing systems, more fine-grained hospital operations data are becoming available. These data include hospital architectural drawings, logs of interactions between patients and healthcare professionals, prescription data, procedures data, and data on patient admission, discharge, and transfers. This has opened up many fascinating avenues for healthcare-related prediction tasks for improving patient care. However, in order to leverage off-the-shelf machine learning software for these tasks, one needs to learn structured representations of entities involved from heterogeneous, dynamic data streams. Here, we propose DECENT, an auto-encoding heterogeneous co-evolving dynamic neural network, for learning heterogeneous dynamic embeddings of patients, doctors, rooms, and medications from diverse data streams. These embeddings capture similarities among doctors, rooms, patients, and medications based on static attributes and dynamic interactions. DECENT enables several applications in healthcare prediction, such as predicting mortality risk and case severity of patients, adverse events (e.g., transfer back into an intensive care unit), and future healthcare-associated infections. The results of using the learned patient embeddings in predictive modeling show that DECENT has a gain of up to 48.1% on the mortality risk prediction task, 12.6% on the case severity prediction task, 6.4% on the medical intensive care unit transfer task, and 3.8% on the Clostridioides difficile (C.diff) Infection (CDI) prediction task over the state-of-the-art baselines. In addition, case studies on the learned doctor, medication, and room embeddings show that our approach learns meaningful and interpretable embeddings.
EINNs: Epidemiologically-Informed Neural Networks
Feb 21, 2022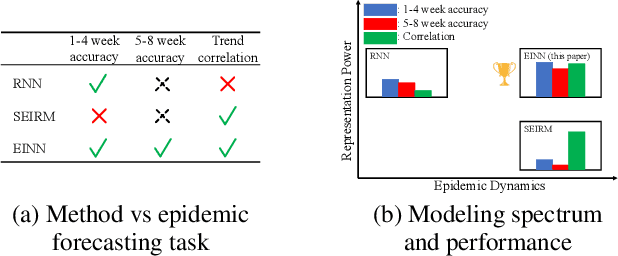
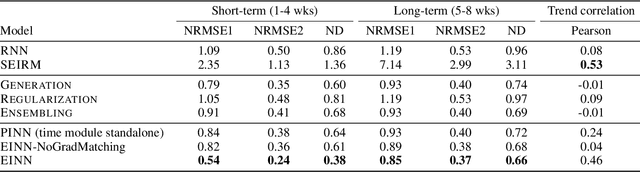
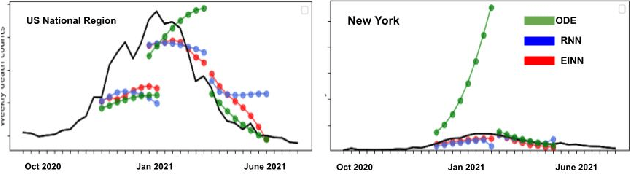
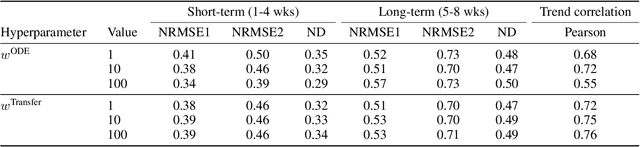
We introduce a new class of physics-informed neural networks-EINN-crafted for epidemic forecasting. We investigate how to leverage both the theoretical flexibility provided by mechanistic models as well as the data-driven expressability afforded by AI models, to ingest heterogeneous information. Although neural forecasting models has been successful in multiple tasks, long-term predictions and anticipating trend changes remain open challenges. Epidemiological ODE models contain mechanisms that can guide us in these two tasks; however, they have limited capability of ingesting data sources and modeling composite signals. Thus we propose to supervise neural networks with epidemic mechanistic models while simultaneously learning their hidden dynamics. Our method EINN allows neural models have the flexibility to learn the disease spread dynamics and use auxiliary features in a general framework. In contrast with previous work, we not assume the observability of complete dynamics and do not need to numerically solve the ODE equations during training. Our thorough experiments showcase the clear benefits of our approach with other non-trivial alternatives.
Incorporating Expert Guidance in Epidemic Forecasting
Dec 24, 2020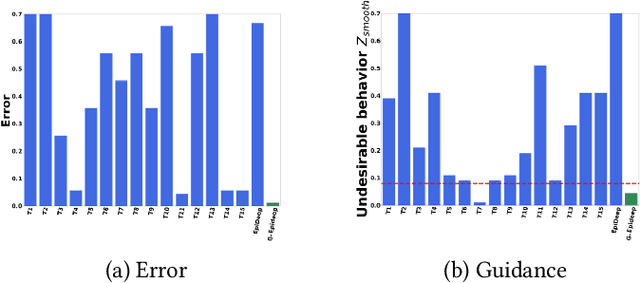

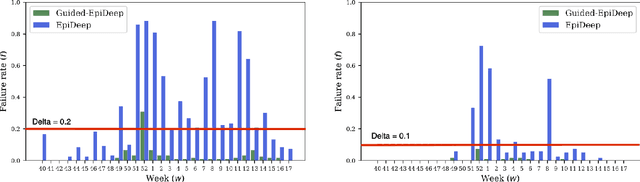

Forecasting influenza like illnesses (ILI) has rapidly progressed in recent years from an art to a science with a plethora of data-driven methods. While these methods have achieved qualified success, their applicability is limited due to their inability to incorporate expert feedback and guidance systematically into the forecasting framework. We propose a new approach leveraging the Seldonian optimization framework from AI safety and demonstrate how it can be adapted to epidemic forecasting. We study two types of guidance: smoothness and regional consistency of errors, where we show that by its successful incorporation, we are able to not only bound the probability of undesirable behavior to happen, but also to reduce RMSE on test data by up to 17%.
Mapping Network States Using Connectivity Queries
Dec 24, 2020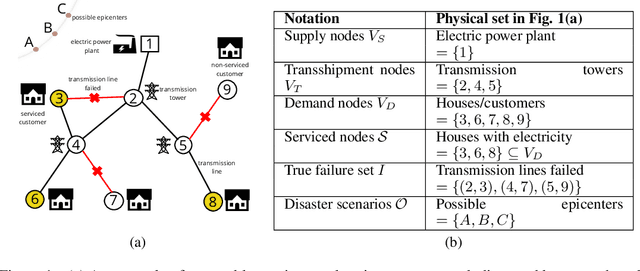
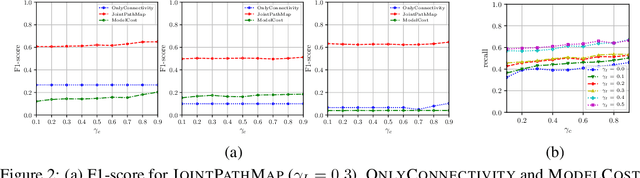
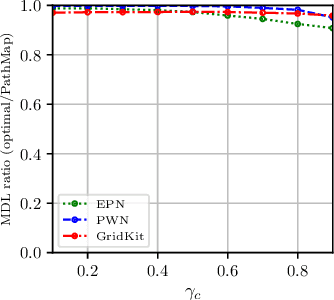
Can we infer all the failed components of an infrastructure network, given a sample of reachable nodes from supply nodes? One of the most critical post-disruption processes after a natural disaster is to quickly determine the damage or failure states of critical infrastructure components. However, this is non-trivial, considering that often only a fraction of components may be accessible or observable after a disruptive event. Past work has looked into inferring failed components given point probes, i.e. with a direct sample of failed components. In contrast, we study the harder problem of inferring failed components given partial information of some `serviceable' reachable nodes and a small sample of point probes, being the first often more practical to obtain. We formulate this novel problem using the Minimum Description Length (MDL) principle, and then present a greedy algorithm that minimizes MDL cost effectively. We evaluate our algorithm on domain-expert simulations of real networks in the aftermath of an earthquake. Our algorithm successfully identify failed components, especially the critical ones affecting the overall system performance.
NetReAct: Interactive Learning for Network Summarization
Dec 22, 2020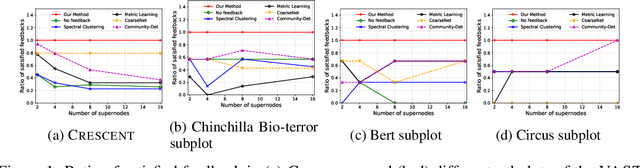
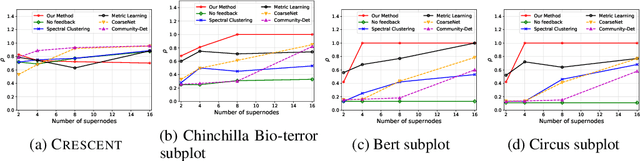
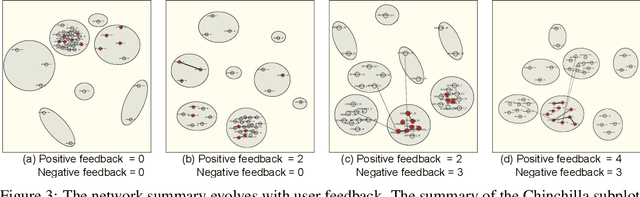
Generating useful network summaries is a challenging and important problem with several applications like sensemaking, visualization, and compression. However, most of the current work in this space do not take human feedback into account while generating summaries. Consider an intelligence analysis scenario, where the analyst is exploring a similarity network between documents. The analyst can express her agreement/disagreement with the visualization of the network summary via iterative feedback, e.g. closing or moving documents ("nodes") together. How can we use this feedback to improve the network summary quality? In this paper, we present NetReAct, a novel interactive network summarization algorithm which supports the visualization of networks induced by text corpora to perform sensemaking. NetReAct incorporates human feedback with reinforcement learning to summarize and visualize document networks. Using scenarios from two datasets, we show how NetReAct is successful in generating high-quality summaries and visualizations that reveal hidden patterns better than other non-trivial baselines.
Steering a Historical Disease Forecasting Model Under a Pandemic: Case of Flu and COVID-19
Sep 23, 2020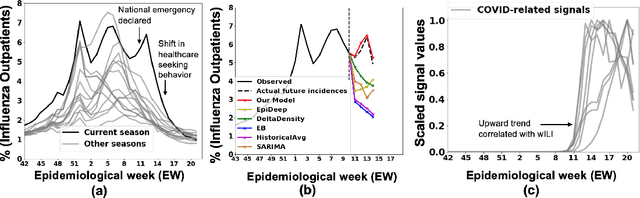
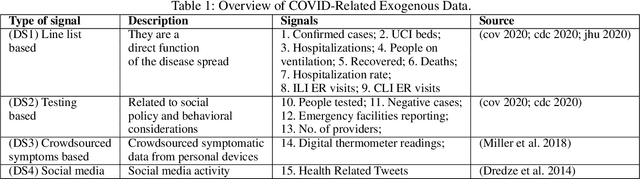
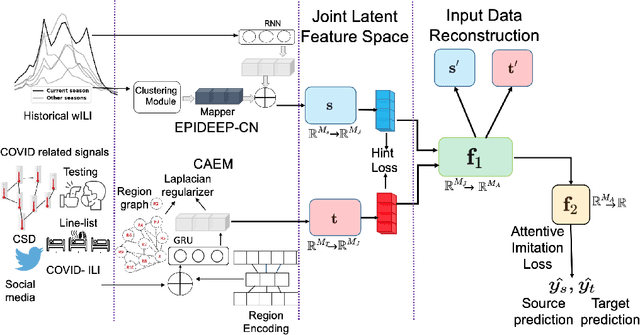
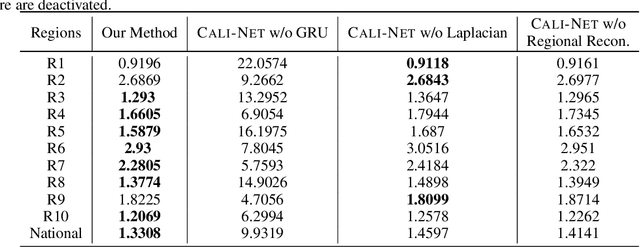
Forecasting influenza in a timely manner aids health organizations and policymakers in adequate preparation and decision making. However, effective influenza forecasting still remains a challenge despite increasing research interest. It is even more challenging amidst the COVID pandemic, when the influenza-like illness (ILI) counts is affected by various factors such as symptomatic similarities with COVID-19 and shift in healthcare seeking patterns of the general population. We term the ILI values observed when it is potentially affected as COVID-ILI. Under the current pandemic, historical influenza models carry valuable expertise about the disease dynamics but face difficulties adapting. Therefore, we propose CALI-NET, a neural transfer learning architecture which allows us to 'steer' a historical disease forecasting model to new scenarios where flu and COVID co-exist. Our framework enables this adaptation by automatically learning when it is should emphasize learning from COVID-related signals and when from the historical model. In such way, we exploit representations learned from historical ILI data as well as the limited COVID-related signals. Our experiments demonstrate that our approach is successful in adapting a historical forecasting model to the current pandemic. In addition, we show that success in our primary goal, adaptation, does not sacrifice overall performance as compared with state-of-the-art influenza forecasting approaches.
Distributed Representation of Subgraphs
Feb 22, 2017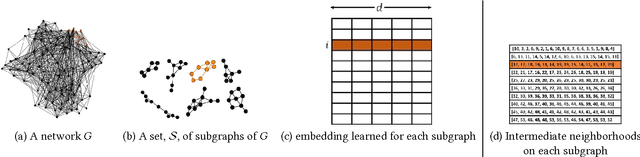
Network embeddings have become very popular in learning effective feature representations of networks. Motivated by the recent successes of embeddings in natural language processing, researchers have tried to find network embeddings in order to exploit machine learning algorithms for mining tasks like node classification and edge prediction. However, most of the work focuses on finding distributed representations of nodes, which are inherently ill-suited to tasks such as community detection which are intuitively dependent on subgraphs. Here, we propose sub2vec, an unsupervised scalable algorithm to learn feature representations of arbitrary subgraphs. We provide means to characterize similarties between subgraphs and provide theoretical analysis of sub2vec and demonstrate that it preserves the so-called local proximity. We also highlight the usability of sub2vec by leveraging it for network mining tasks, like community detection. We show that sub2vec gets significant gains over state-of-the-art methods and node-embedding methods. In particular, sub2vec offers an approach to generate a richer vocabulary of features of subgraphs to support representation and reasoning.