Maria d'Errico
DADApy: Distance-based Analysis of DAta-manifolds in Python
May 04, 2022

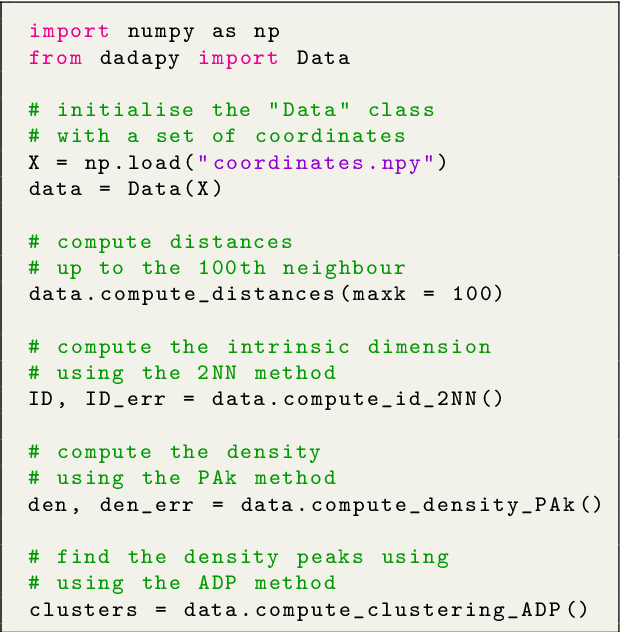
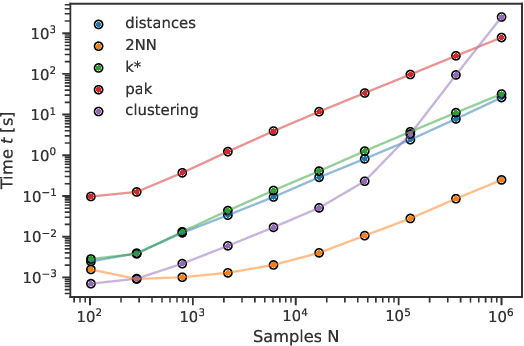
Abstract:DADApy is a python software package for analysing and characterising high-dimensional data manifolds. It provides methods for estimating the intrinsic dimension and the probability density, for performing density-based clustering and for comparing different distance metrics. We review the main functionalities of the package and exemplify its usage in toy cases and in a real-world application. The package is freely available under the open-source Apache 2.0 license and can be downloaded from the Github page https://github.com/sissa-data-science/DADApy.
Estimating the intrinsic dimension of datasets by a minimal neighborhood information
Mar 19, 2018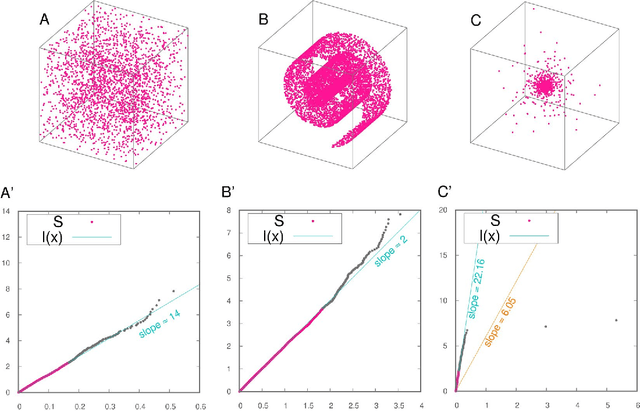
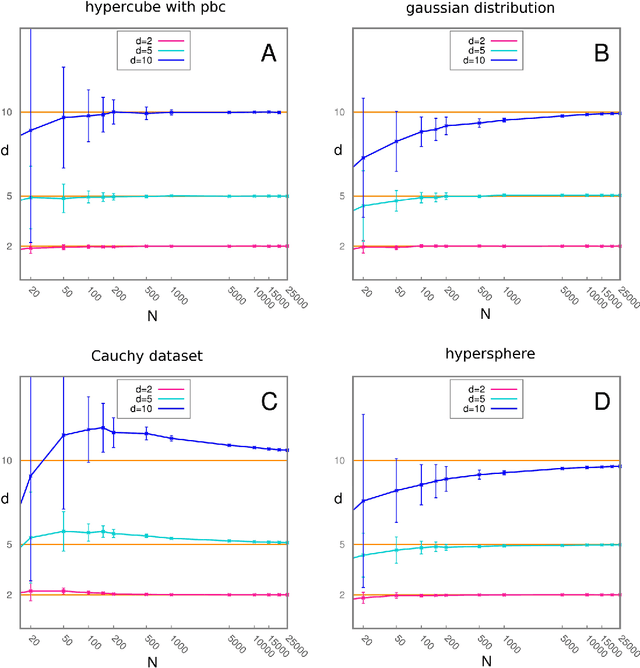
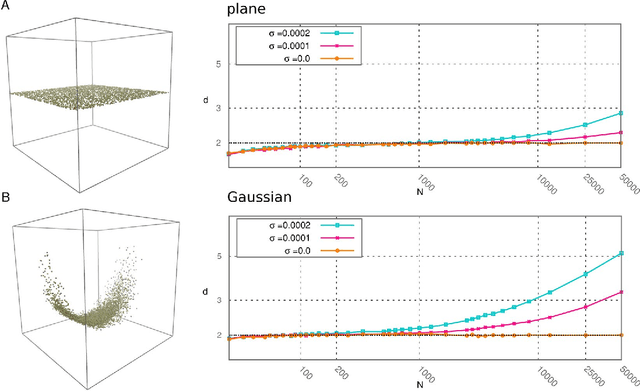
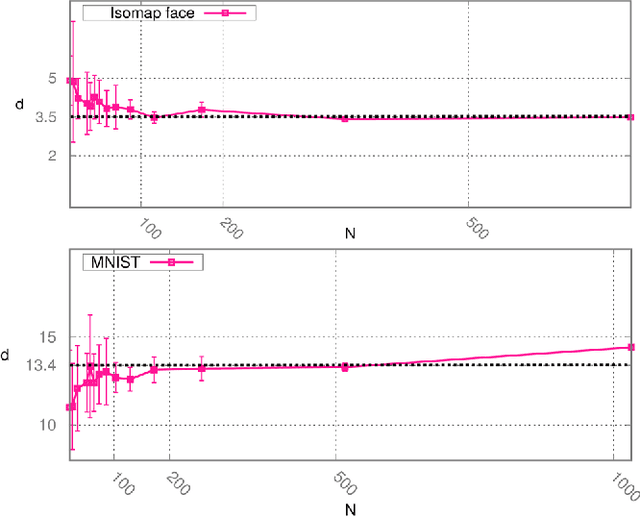
Abstract:Analyzing large volumes of high-dimensional data is an issue of fundamental importance in data science, molecular simulations and beyond. Several approaches work on the assumption that the important content of a dataset belongs to a manifold whose Intrinsic Dimension (ID) is much lower than the crude large number of coordinates. Such manifold is generally twisted and curved, in addition points on it will be non-uniformly distributed: two factors that make the identification of the ID and its exploitation really hard. Here we propose a new ID estimator using only the distance of the first and the second nearest neighbor of each point in the sample. This extreme minimality enables us to reduce the effects of curvature, of density variation, and the resulting computational cost. The ID estimator is theoretically exact in uniformly distributed datasets, and provides consistent measures in general. When used in combination with block analysis, it allows discriminating the relevant dimensions as a function of the block size. This allows estimating the ID even when the data lie on a manifold perturbed by a high-dimensional noise, a situation often encountered in real world data sets. We demonstrate the usefulness of the approach on molecular simulations and image analysis.
Automatic topography of high-dimensional data sets by non-parametric Density Peak clustering
Feb 28, 2018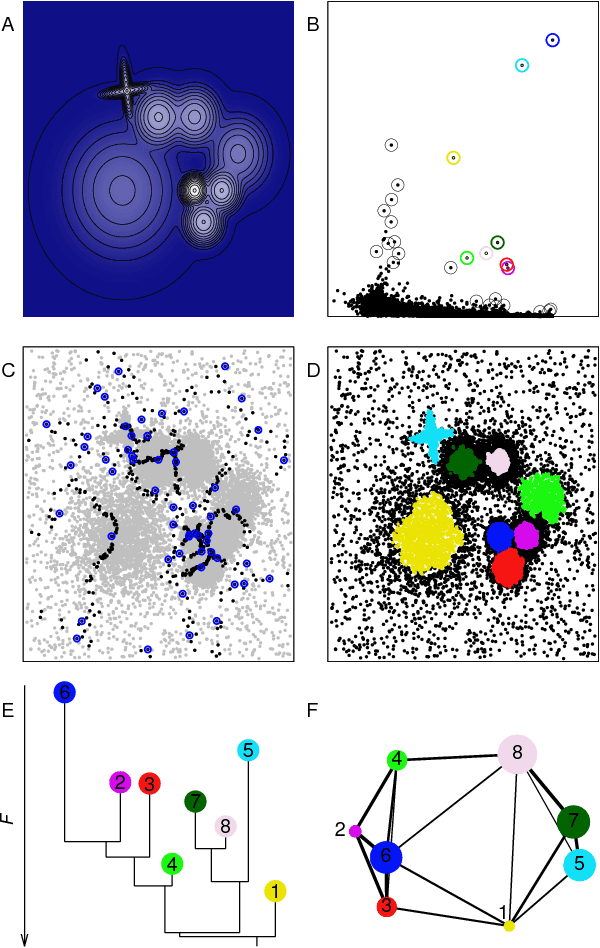
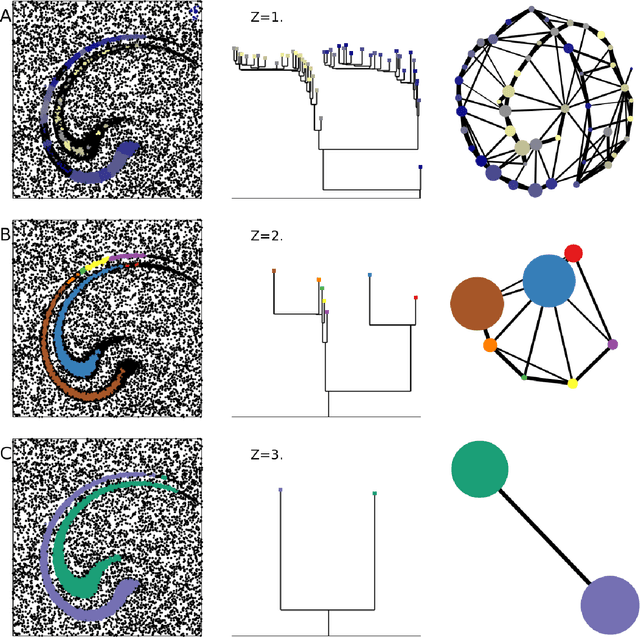
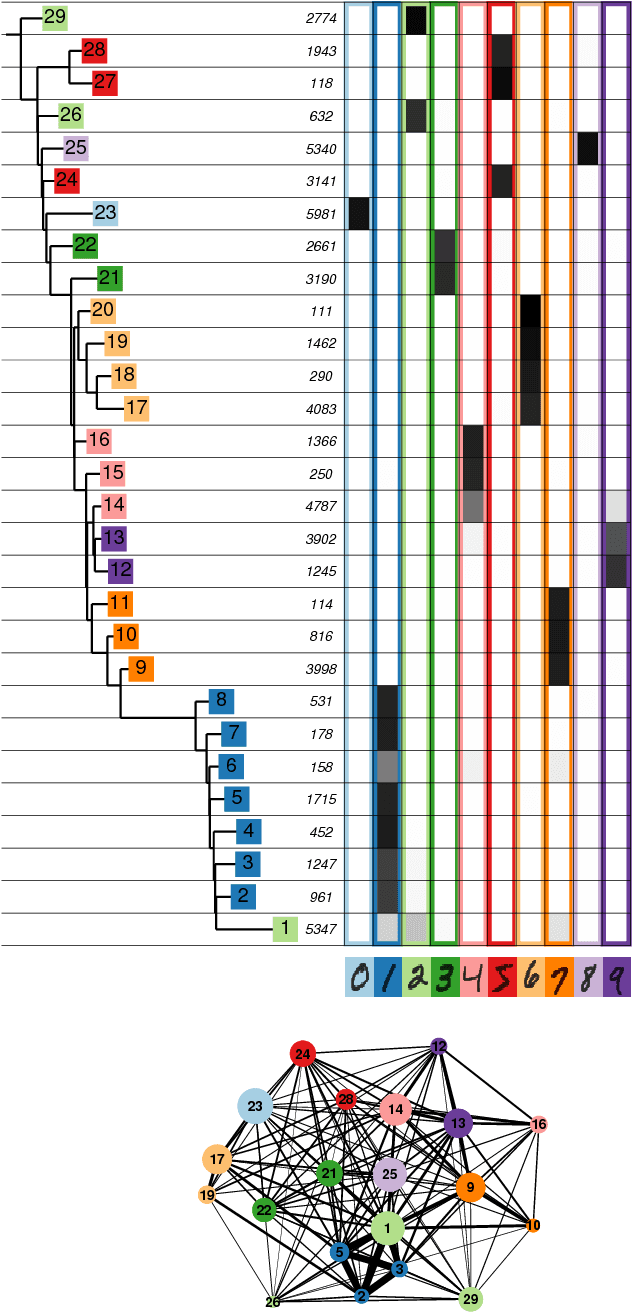
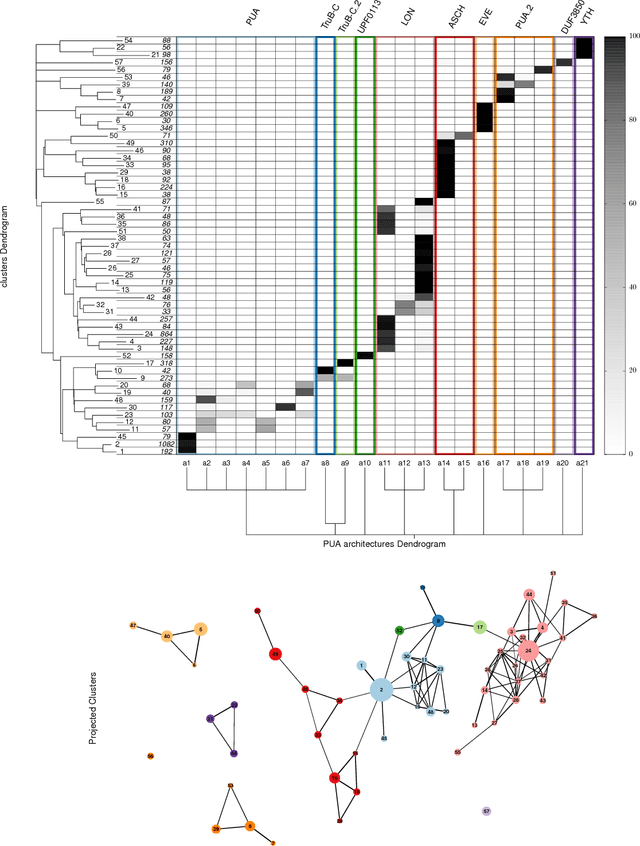
Abstract:Data analysis in high-dimensional spaces aims at obtaining a synthetic description of a data set, revealing its main structure and its salient features. We here introduce an approach for charting data spaces, providing a topography of the probability distribution from which the data are harvested. This topography includes information on the number and the height of the probability peaks, the depth of the "valleys" separating them, the relative location of the peaks and their hierarchical organization. The topography is reconstructed by using an unsupervised variant of Density Peak clustering exploiting a non-parametric density estimator, which automatically measures the density in the manifold containing the data. Importantly, the density estimator provides an estimate of the error. This is a key feature, which allows distinguishing genuine probability peaks from density fluctuations due to finite sampling.
 Add to Chrome
 Add to Firefox
 Add to Edge