Kwangho Kim
Semiparametric Counterfactual Regression
Apr 03, 2025Abstract:We study counterfactual regression, which aims to map input features to outcomes under hypothetical scenarios that differ from those observed in the data. This is particularly useful for decision-making when adapting to sudden shifts in treatment patterns is essential. We propose a doubly robust-style estimator for counterfactual regression within a generalizable framework that accommodates a broad class of risk functions and flexible constraints, drawing on tools from semiparametric theory and stochastic optimization. Our approach uses incremental interventions to enhance adaptability while maintaining consistency with standard methods. We formulate the target estimand as the optimal solution to a stochastic optimization problem and develop an efficient estimation strategy, where we can leverage rapid development of modern optimization algorithms. We go on to analyze the rates of convergence and characterize the asymptotic distributions. Our analysis shows that the proposed estimators can achieve $\sqrt{n}$-consistency and asymptotic normality for a broad class of problems. Numerical illustrations highlight their effectiveness in adapting to unseen counterfactual scenarios while maintaining parametric convergence rates.
Hierarchical and Density-based Causal Clustering
Nov 02, 2024


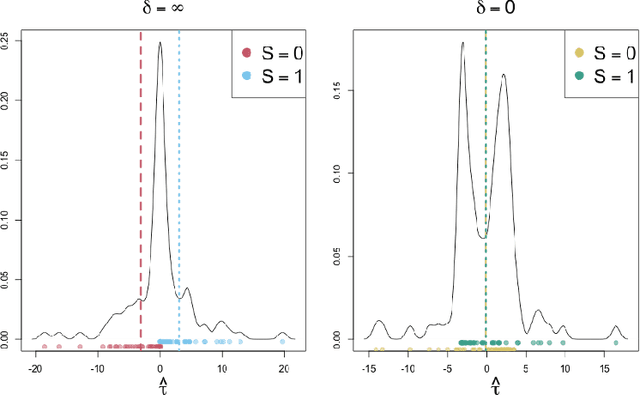
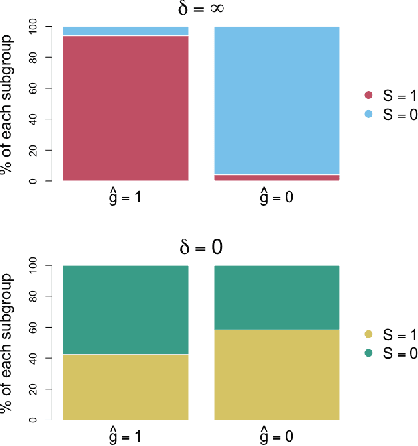
Abstract:Understanding treatment effect heterogeneity is vital for scientific and policy research. However, identifying and evaluating heterogeneous treatment effects pose significant challenges due to the typically unknown subgroup structure. Recently, a novel approach, causal k-means clustering, has emerged to assess heterogeneity of treatment effect by applying the k-means algorithm to unknown counterfactual regression functions. In this paper, we expand upon this framework by integrating hierarchical and density-based clustering algorithms. We propose plug-in estimators that are simple and readily implementable using off-the-shelf algorithms. Unlike k-means clustering, which requires the margin condition, our proposed estimators do not rely on strong structural assumptions on the outcome process. We go on to study their rate of convergence, and show that under the minimal regularity conditions, the additional cost of causal clustering is essentially the estimation error of the outcome regression functions. Our findings significantly extend the capabilities of the causal clustering framework, thereby contributing to the progression of methodologies for identifying homogeneous subgroups in treatment response, consequently facilitating more nuanced and targeted interventions. The proposed methods also open up new avenues for clustering with generic pseudo-outcomes. We explore finite sample properties via simulation, and illustrate the proposed methods in voting and employment projection datasets.
Causal K-Means Clustering
May 05, 2024
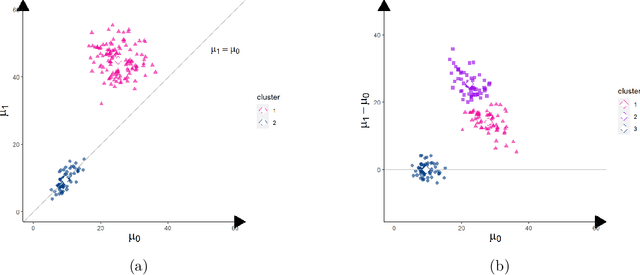
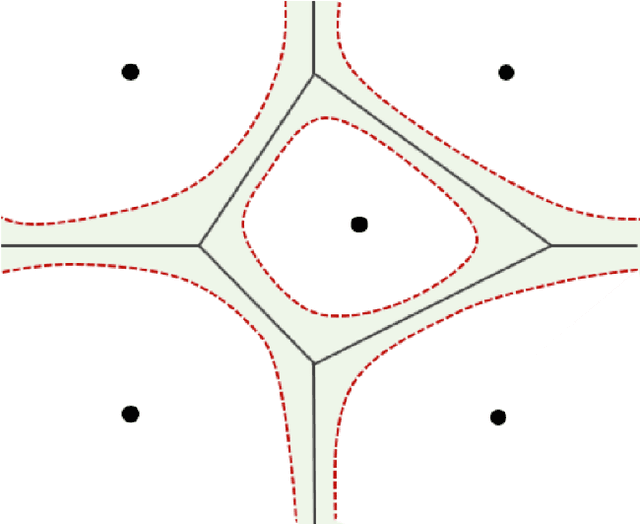
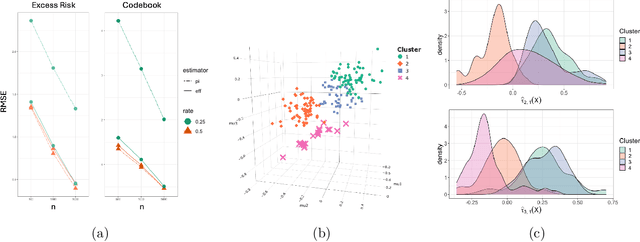
Abstract:Causal effects are often characterized with population summaries. These might provide an incomplete picture when there are heterogeneous treatment effects across subgroups. Since the subgroup structure is typically unknown, it is more challenging to identify and evaluate subgroup effects than population effects. We propose a new solution to this problem: Causal k-Means Clustering, which harnesses the widely-used k-means clustering algorithm to uncover the unknown subgroup structure. Our problem differs significantly from the conventional clustering setup since the variables to be clustered are unknown counterfactual functions. We present a plug-in estimator which is simple and readily implementable using off-the-shelf algorithms, and study its rate of convergence. We also develop a new bias-corrected estimator based on nonparametric efficiency theory and double machine learning, and show that this estimator achieves fast root-n rates and asymptotic normality in large nonparametric models. Our proposed methods are especially useful for modern outcome-wide studies with multiple treatment levels. Further, our framework is extensible to clustering with generic pseudo-outcomes, such as partially observed outcomes or otherwise unknown functions. Finally, we explore finite sample properties via simulation, and illustrate the proposed methods in a study of treatment programs for adolescent substance abuse.
Scalable kernel balancing weights in a nationwide observational study of hospital profit status and heart attack outcomes
Nov 01, 2023Abstract:Weighting is a general and often-used method for statistical adjustment. Weighting has two objectives: first, to balance covariate distributions, and second, to ensure that the weights have minimal dispersion and thus produce a more stable estimator. A recent, increasingly common approach directly optimizes the weights toward these two objectives. However, this approach has not yet been feasible in large-scale datasets when investigators wish to flexibly balance general basis functions in an extended feature space. For example, many balancing approaches cannot scale to national-level health services research studies. To address this practical problem, we describe a scalable and flexible approach to weighting that integrates a basis expansion in a reproducing kernel Hilbert space with state-of-the-art convex optimization techniques. Specifically, we use the rank-restricted Nystr\"{o}m method to efficiently compute a kernel basis for balancing in {nearly} linear time and space, and then use the specialized first-order alternating direction method of multipliers to rapidly find the optimal weights. In an extensive simulation study, we provide new insights into the performance of weighting estimators in large datasets, showing that the proposed approach substantially outperforms others in terms of accuracy and speed. Finally, we use this weighting approach to conduct a national study of the relationship between hospital profit status and heart attack outcomes in a comprehensive dataset of 1.27 million patients. We find that for-profit hospitals use interventional cardiology to treat heart attacks at similar rates as other hospitals, but have higher mortality and readmission rates.
Fair and Robust Estimation of Heterogeneous Treatment Effects for Policy Learning
Jun 06, 2023
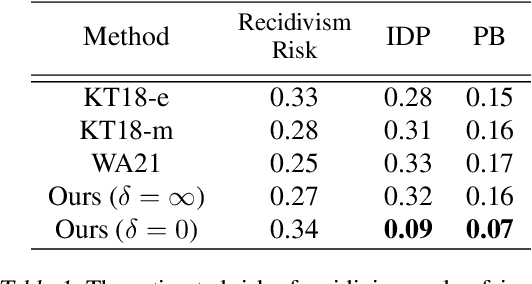
Abstract:We propose a simple and general framework for nonparametric estimation of heterogeneous treatment effects under fairness constraints. Under standard regularity conditions, we show that the resulting estimators possess the double robustness property. We use this framework to characterize the trade-off between fairness and the maximum welfare achievable by the optimal policy. We evaluate the methods in a simulation study and illustrate them in a real-world case study.
Doubly Robust Counterfactual Classification
Jan 15, 2023Abstract:We study counterfactual classification as a new tool for decision-making under hypothetical (contrary to fact) scenarios. We propose a doubly-robust nonparametric estimator for a general counterfactual classifier, where we can incorporate flexible constraints by casting the classification problem as a nonlinear mathematical program involving counterfactuals. We go on to analyze the rates of convergence of the estimator and provide a closed-form expression for its asymptotic distribution. Our analysis shows that the proposed estimator is robust against nuisance model misspecification, and can attain fast $\sqrt{n}$ rates with tractable inference even when using nonparametric machine learning approaches. We study the empirical performance of our methods by simulation and apply them for recidivism risk prediction.
Efficient Topological Layer based on Persistent Landscapes
Feb 07, 2020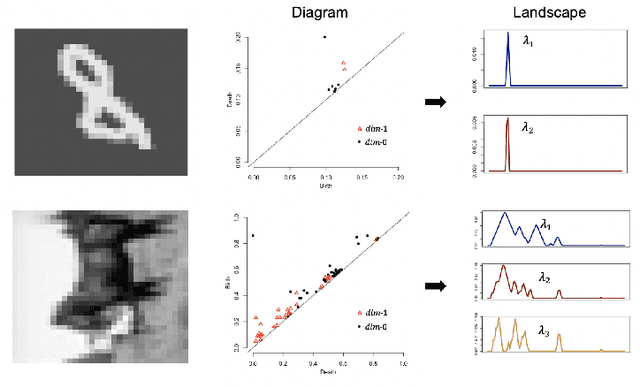

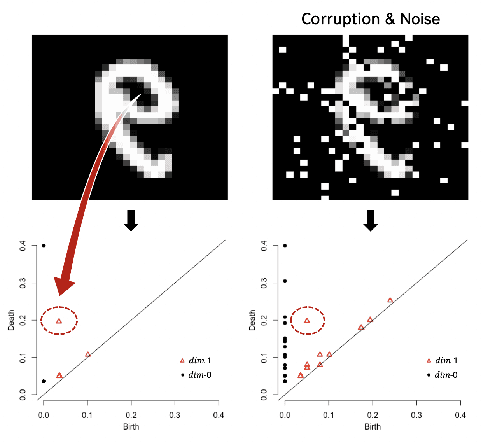

Abstract:We propose a novel topological layer for general deep learning models based on persistent landscapes, in which we can efficiently exploit underlying topological features of the input data structure. We use the robust DTM function and show differentiability with respect to layer inputs, for a general persistent homology with arbitrary filtration. Thus, our proposed layer can be placed anywhere in the network architecture and feed critical information on the topological features of input data into subsequent layers to improve the learnability of the networks toward a given task. A task-optimal structure of the topological layer is learned during training via backpropagation, without requiring any input featurization or data preprocessing. We provide a tight stability theorem, and show that the proposed layer is robust towards noise and outliers. We demonstrate the effectiveness of our approach by classification experiments on various datasets.
Incremental Intervention Effects in Studies with Many Timepoints, Repeated Outcomes, and Dropout
Jul 09, 2019
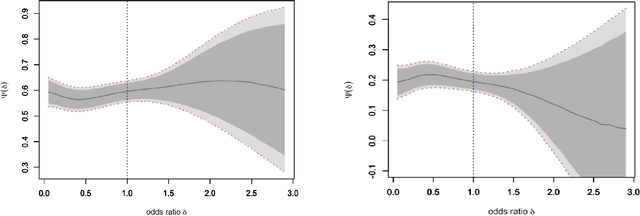
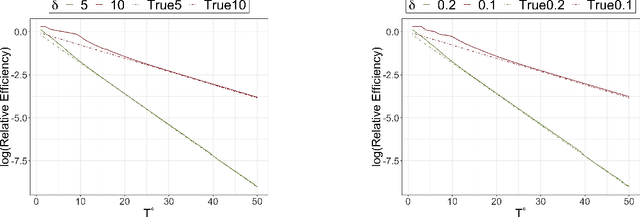

Abstract:Modern longitudinal studies feature data collected at many timepoints, often of the same order of sample size. Such studies are typically affected by dropout and positivity violations. We tackle these problems by generalizing effects of recent incremental interventions (which shift propensity scores rather than set treatment values deterministically) to accommodate multiple outcomes and subject dropout. We give an identifying expression for incremental effects when dropout is conditionally ignorable (without requiring treatment positivity), and derive the nonparametric efficiency bound for estimating such effects. Then we present efficient nonparametric estimators, showing that they converge at fast parametric rates and yield uniform inferential guarantees, even when nuisance functions are estimated flexibly at slower rates. We also study the efficiency of incremental effects relative to more conventional deterministic effects in a novel infinite time horizon setting, where the number of timepoints grows with sample size, and show that incremental effects yield near-exponential gains in this setup. Finally we conclude with simulations and apply our methods in a study of the effect of low-dose aspirin on pregnancy outcomes.
Time Series Featurization via Topological Data Analysis: an Application to Cryptocurrency Trend Forecasting
Dec 07, 2018


Abstract:We propose a novel methodology for feature extraction from time series data based on topological data analysis. The proposed procedure applies a dimensionality reduction technique via principal component analysis to the point cloud of the Takens' embedding from the observed time series and then evaluates the persistence landscape and silhouettes based on the corresponding Rips complex. We define a new notion of Rips distance function that is especially suited for persistence homologies built on Rips complexes and prove stability theorems for it. We use these results to demonstrate in turn some stability properties of the topological features extracted using our procedure with respect to additive noise and sampling. We further apply our method to the problem of trend forecasting for cryptocurrency prices, where we manage to achieve significantly lower error rates than more standard, non TDA-based methodologies in complex pattern classification tasks. We expect our method to provide a new insight on feature engineering for granular, noisy time series data.
Causal effects based on distributional distances
Jun 08, 2018


Abstract:We develop a novel framework for estimating causal effects based on the discrepancy between unobserved counterfactual distributions. In our setting a causal effect is defined in terms of the $L_1$ distance between different counterfactual outcome distributions, rather than a mean difference in outcome values. Directly comparing counterfactual outcome distributions can provide more nuanced and valuable information about causality than a simple comparison of means. We consider single- and multi-source randomized studies, as well as observational studies, and analyze error bounds and asymptotic properties of the proposed estimators. We further propose methods to construct confidence intervals for the unknown mean distribution distance. Finally, we illustrate the new methods and verify their effectiveness in empirical studies.
 Add to Chrome
 Add to Firefox
 Add to Edge