Klaus Ackermann
Automated Assessment of Residual Plots with Computer Vision Models
Nov 01, 2024Abstract:Plotting the residuals is a recommended procedure to diagnose deviations from linear model assumptions, such as non-linearity, heteroscedasticity, and non-normality. The presence of structure in residual plots can be tested using the lineup protocol to do visual inference. There are a variety of conventional residual tests, but the lineup protocol, used as a statistical test, performs better for diagnostic purposes because it is less sensitive and applies more broadly to different types of departures. However, the lineup protocol relies on human judgment which limits its scalability. This work presents a solution by providing a computer vision model to automate the assessment of residual plots. It is trained to predict a distance measure that quantifies the disparity between the residual distribution of a fitted classical normal linear regression model and the reference distribution, based on Kullback-Leibler divergence. From extensive simulation studies, the computer vision model exhibits lower sensitivity than conventional tests but higher sensitivity than human visual tests. It is slightly less effective on non-linearity patterns. Several examples from classical papers and contemporary data illustrate the new procedures, highlighting its usefulness in automating the diagnostic process and supplementing existing methods.
Bayesian Neural Network Versus Ex-Post Calibration For Prediction Uncertainty
Sep 29, 2022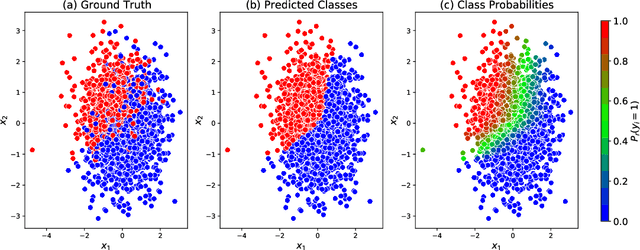
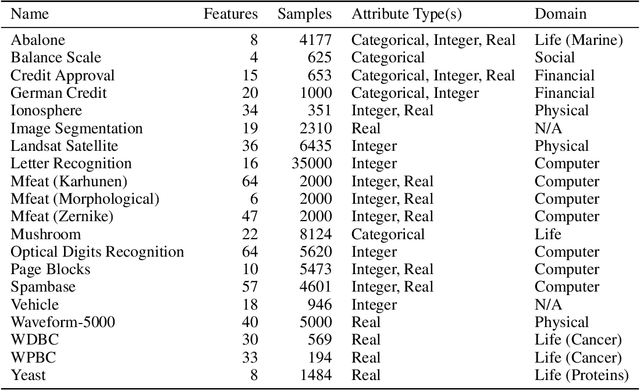
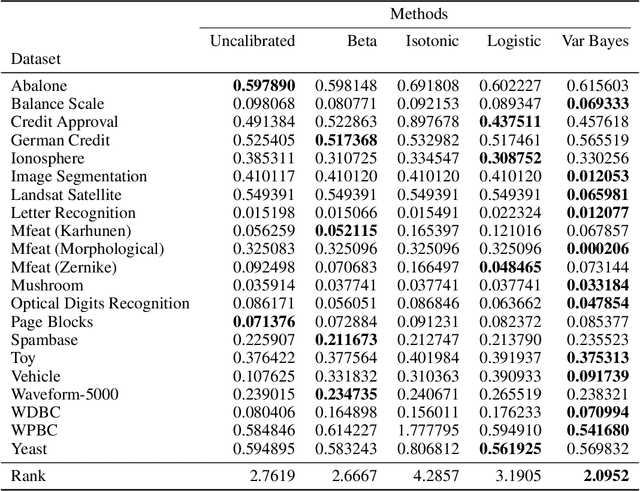
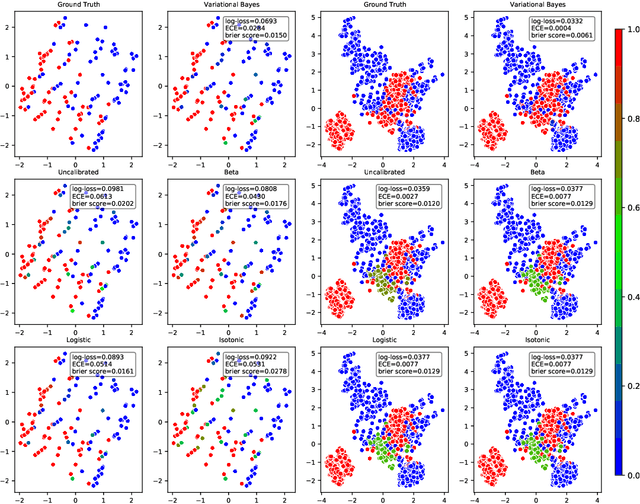
Abstract:Probabilistic predictions from neural networks which account for predictive uncertainty during classification is crucial in many real-world and high-impact decision making settings. However, in practice most datasets are trained on non-probabilistic neural networks which by default do not capture this inherent uncertainty. This well-known problem has led to the development of post-hoc calibration procedures, such as Platt scaling (logistic), isotonic and beta calibration, which transforms the scores into well calibrated empirical probabilities. A plausible alternative to the calibration approach is to use Bayesian neural networks, which directly models a predictive distribution. Although they have been applied to images and text datasets, they have seen limited adoption in the tabular and small data regime. In this paper, we demonstrate that Bayesian neural networks yields competitive performance when compared to calibrated neural networks and conduct experiments across a wide array of datasets.
Forecast Evaluation for Data Scientists: Common Pitfalls and Best Practices
Apr 04, 2022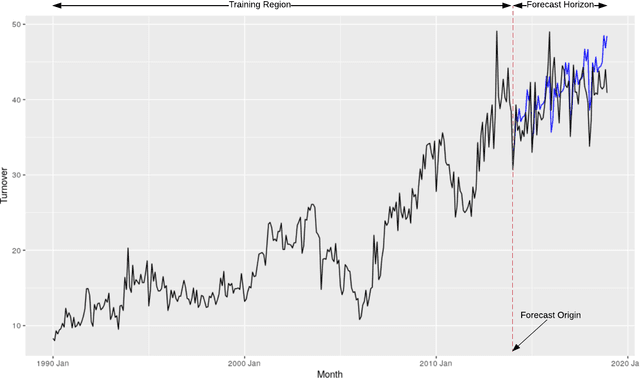
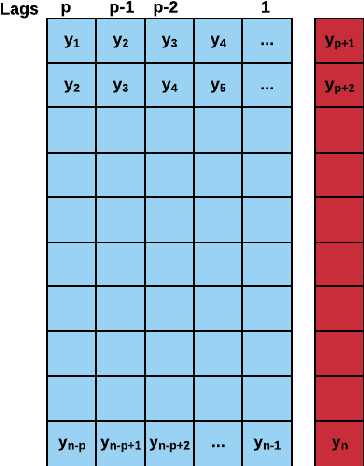
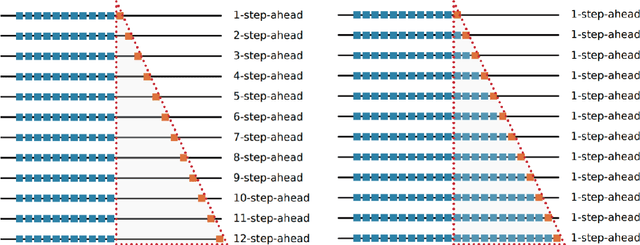
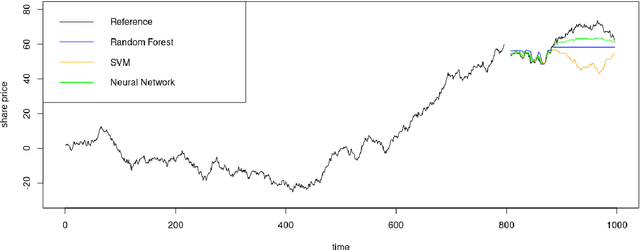
Abstract:Machine Learning (ML) and Deep Learning (DL) methods are increasingly replacing traditional methods in many domains involved with important decision making activities. DL techniques tailor-made for specific tasks such as image recognition, signal processing, or speech analysis are being introduced at a fast pace with many improvements. However, for the domain of forecasting, the current state in the ML community is perhaps where other domains such as Natural Language Processing and Computer Vision were at several years ago. The field of forecasting has mainly been fostered by statisticians/econometricians; consequently the related concepts are not the mainstream knowledge among general ML practitioners. The different non-stationarities associated with time series challenge the data-driven ML models. Nevertheless, recent trends in the domain have shown that with the availability of massive amounts of time series, ML techniques are quite competent in forecasting, when related pitfalls are properly handled. Therefore, in this work we provide a tutorial-like compilation of the details of one of the most important steps in the overall forecasting process, namely the evaluation. This way, we intend to impart the information of forecast evaluation to fit the context of ML, as means of bridging the knowledge gap between traditional methods of forecasting and state-of-the-art ML techniques. We elaborate on the different problematic characteristics of time series such as non-normalities and non-stationarities and how they are associated with common pitfalls in forecast evaluation. Best practices in forecast evaluation are outlined with respect to the different steps such as data partitioning, error calculation, statistical testing, and others. Further guidelines are also provided along selecting valid and suitable error measures depending on the specific characteristics of the dataset at hand.
Estimating Sleep & Work Hours from Alternative Data by Segmented Functional Classification Analysis (SFCA)
Oct 16, 2020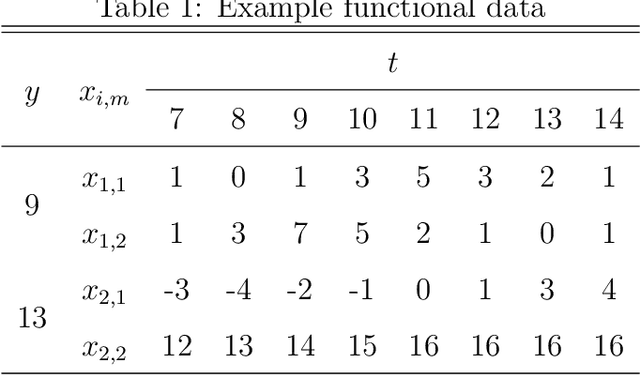
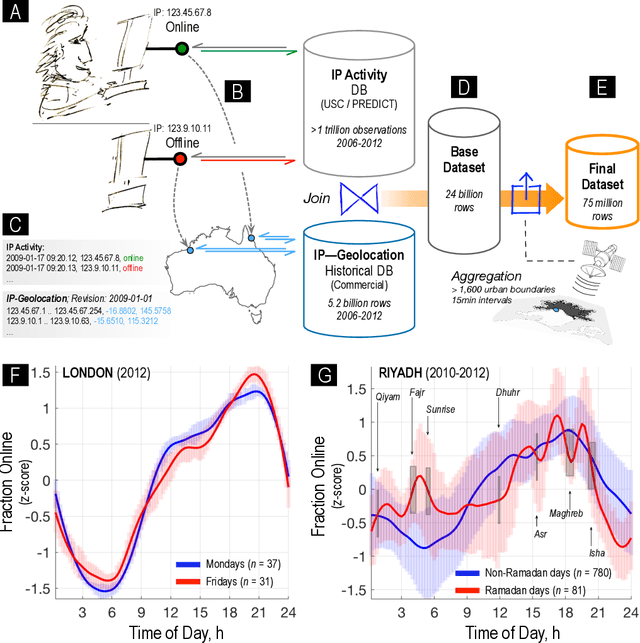
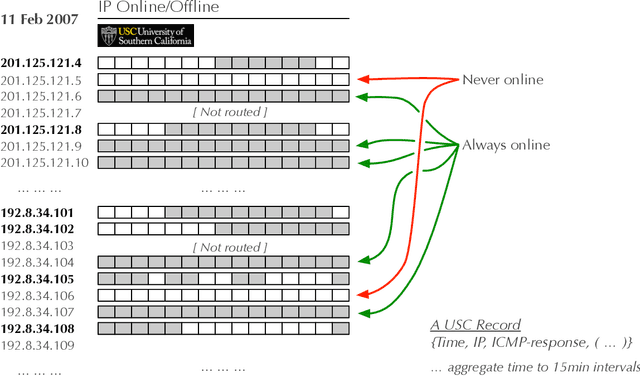
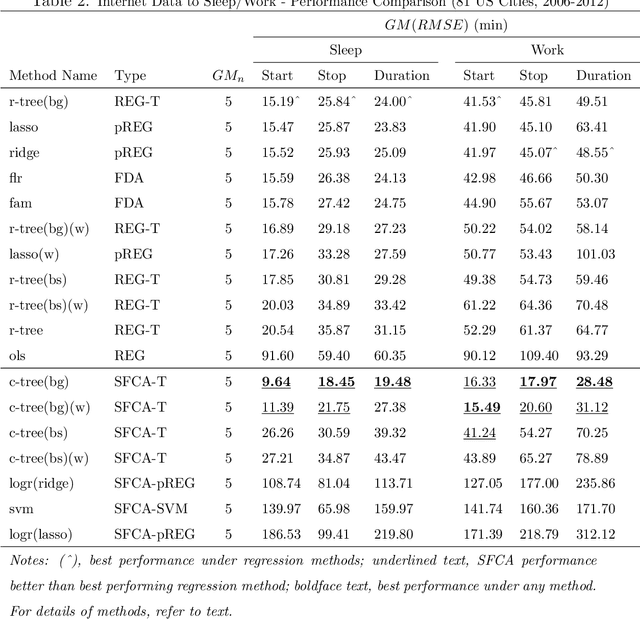
Abstract:Alternative data is increasingly adapted to predict human and economic behaviour. This paper introduces a new type of alternative data by re-conceptualising the internet as a data-driven insights platform at global scale. Using data from a unique internet activity and location dataset drawn from over 1.5 trillion observations of end-user internet connections, we construct a functional dataset covering over 1,600 cities during a 7 year period with temporal resolution of just 15min. To predict accurate temporal patterns of sleep and work activity from this data-set, we develop a new technique, Segmented Functional Classification Analysis (SFCA), and compare its performance to a wide array of linear, functional, and classification methods. To confirm the wider applicability of SFCA, in a second application we predict sleep and work activity using SFCA from US city-wide electricity demand functional data. Across both problems, SFCA is shown to out-perform current methods.
Object Recognition for Economic Development from Daytime Satellite Imagery
Sep 11, 2020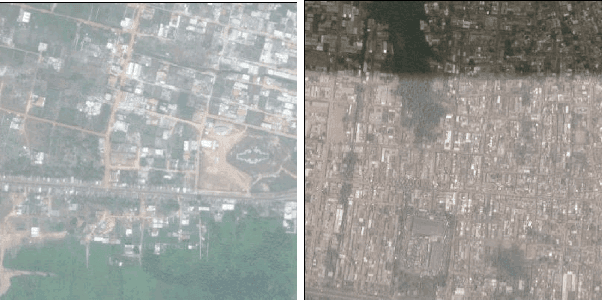

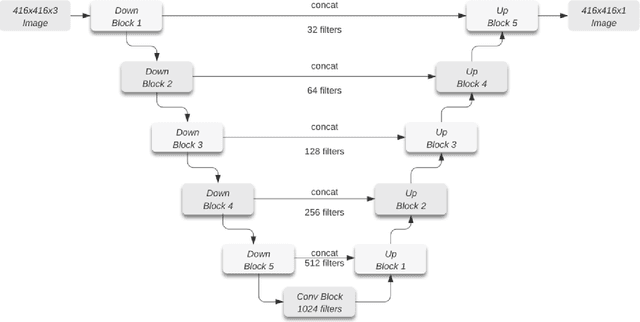
Abstract:Reliable data about the stock of physical capital and infrastructure in developing countries is typically very scarce. This is particular a problem for data at the subnational level where existing data is often outdated, not consistently measured or coverage is incomplete. Traditional data collection methods are time and labor-intensive costly, which often prohibits developing countries from collecting this type of data. This paper proposes a novel method to extract infrastructure features from high-resolution satellite images. We collected high-resolution satellite images for 5 million 1km $\times$ 1km grid cells covering 21 African countries. We contribute to the growing body of literature in this area by training our machine learning algorithm on ground-truth data. We show that our approach strongly improves the predictive accuracy. Our methodology can build the foundation to then predict subnational indicators of economic development for areas where this data is either missing or unreliable.
The Internet as Quantitative Social Science Platform: Insights from a Trillion Observations
Jan 19, 2017


Abstract:With the large-scale penetration of the internet, for the first time, humanity has become linked by a single, open, communications platform. Harnessing this fact, we report insights arising from a unified internet activity and location dataset of an unparalleled scope and accuracy drawn from over a trillion (1.5$\times 10^{12}$) observations of end-user internet connections, with temporal resolution of just 15min over 2006-2012. We first apply this dataset to the expansion of the internet itself over 1,647 urban agglomerations globally. We find that unique IP per capita counts reach saturation at approximately one IP per three people, and take, on average, 16.1 years to achieve; eclipsing the estimated 100- and 60- year saturation times for steam-power and electrification respectively. Next, we use intra-diurnal internet activity features to up-scale traditional over-night sleep observations, producing the first global estimate of over-night sleep duration in 645 cities over 7 years. We find statistically significant variation between continental, national and regional sleep durations including some evidence of global sleep duration convergence. Finally, we estimate the relationship between internet concentration and economic outcomes in 411 OECD regions and find that the internet's expansion is associated with negative or positive productivity gains, depending strongly on sectoral considerations. To our knowledge, our study is the first of its kind to use online/offline activity of the entire internet to infer social science insights, demonstrating the unparalleled potential of the internet as a social data-science platform.
 Add to Chrome
 Add to Firefox
 Add to Edge