Karamjit Singh
Semi-supervised Learning for Marked Temporal Point Processes
Jul 16, 2021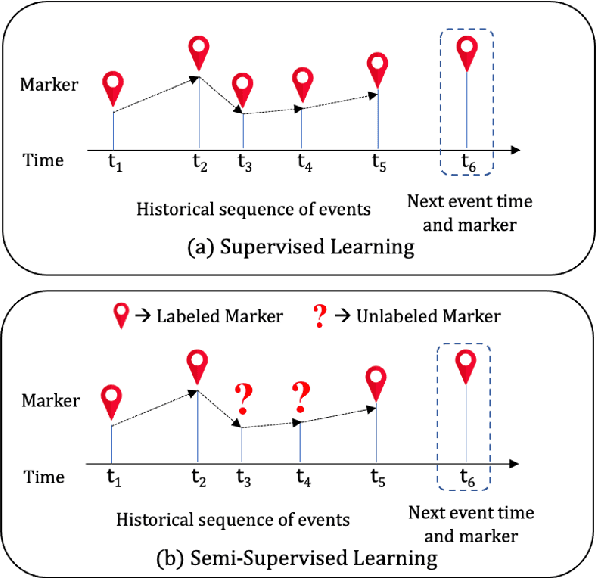
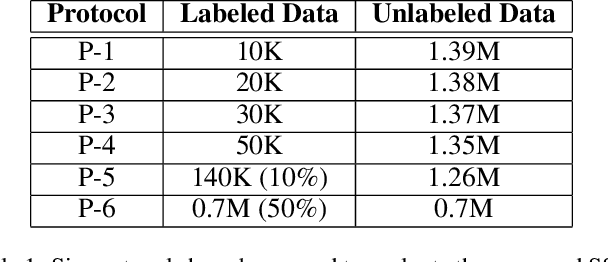


Abstract:Temporal Point Processes (TPPs) are often used to represent the sequence of events ordered as per the time of occurrence. Owing to their flexible nature, TPPs have been used to model different scenarios and have shown applicability in various real-world applications. While TPPs focus on modeling the event occurrence, Marked Temporal Point Process (MTPP) focuses on modeling the category/class of the event as well (termed as the marker). Research in MTPP has garnered substantial attention over the past few years, with an extensive focus on supervised algorithms. Despite the research focus, limited attention has been given to the challenging problem of developing solutions in semi-supervised settings, where algorithms have access to a mix of labeled and unlabeled data. This research proposes a novel algorithm for Semi-supervised Learning for Marked Temporal Point Processes (SSL-MTPP) applicable in such scenarios. The proposed SSL-MTPP algorithm utilizes a combination of labeled and unlabeled data for learning a robust marker prediction model. The proposed algorithm utilizes an RNN-based Encoder-Decoder module for learning effective representations of the time sequence. The efficacy of the proposed algorithm has been demonstrated via multiple protocols on the Retweet dataset, where the proposed SSL-MTPP demonstrates improved performance in comparison to the traditional supervised learning approach.
CIKM AnalytiCup 2017 Lazada Product Title Quality Challenge An Ensemble of Deep and Shallow Learning to predict the Quality of Product Titles
Apr 01, 2018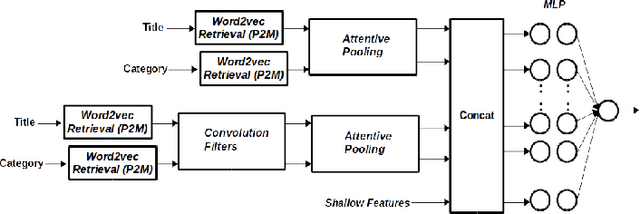

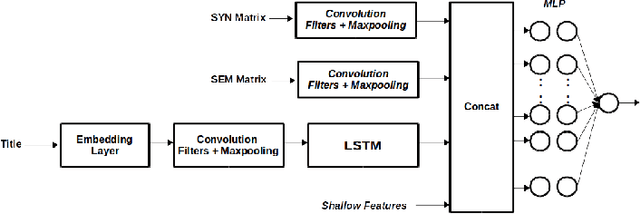

Abstract:We present an approach where two different models (Deep and Shallow) are trained separately on the data and a weighted average of the outputs is taken as the final result. For the Deep approach, we use different combinations of models like Convolution Neural Network, pretrained word2vec embeddings and LSTMs to get representations which are then used to train a Deep Neural Network. For Clarity prediction, we also use an Attentive Pooling approach for the pooling operation so as to be aware of the Title-Category pair. For the shallow approach, we use boosting technique LightGBM on features generated using title and categories. We find that an ensemble of these approaches does a better job than using them alone suggesting that the results of the deep and shallow approach are highly complementary
Crop Planning using Stochastic Visual Optimization
Oct 25, 2017


Abstract:As the world population increases and arable land decreases, it becomes vital to improve the productivity of the agricultural land available. Given the weather and soil properties, farmers need to take critical decisions such as which seed variety to plant and in what proportion, in order to maximize productivity. These decisions are irreversible and any unusual behavior of external factors, such as weather, can have catastrophic impact on the productivity of crop. A variety which is highly desirable to a farmer might be unavailable or in short supply, therefore, it is very critical to evaluate which variety or varieties are more likely to be chosen by farmers from a growing region in order to meet demand. In this paper, we present our visual analytics tool, ViSeed, showcased on the data given in Syngenta 2016 crop data challenge 1 . This tool helps to predict optimal soybean seed variety or mix of varieties in appropriate proportions which is more likely to be chosen by farmers from a growing region. It also allows to analyse solutions generated from our approach and helps in the decision making process by providing insightful visualizations
Comparative Benchmarking of Causal Discovery Techniques
Sep 12, 2017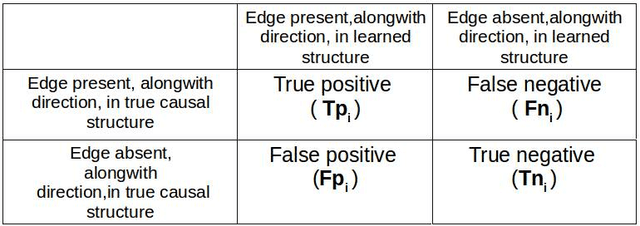
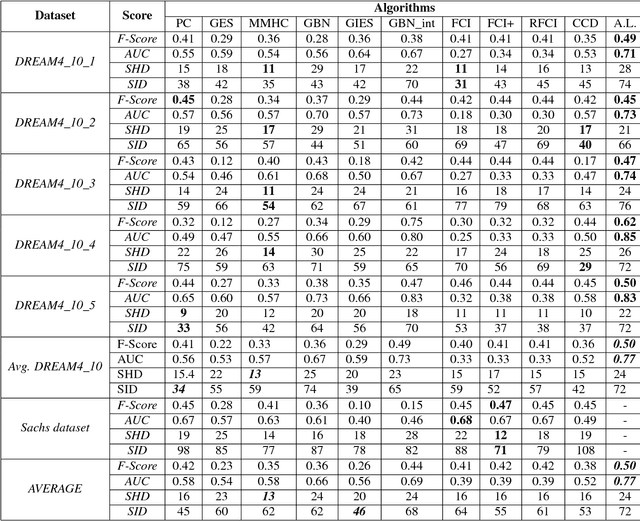
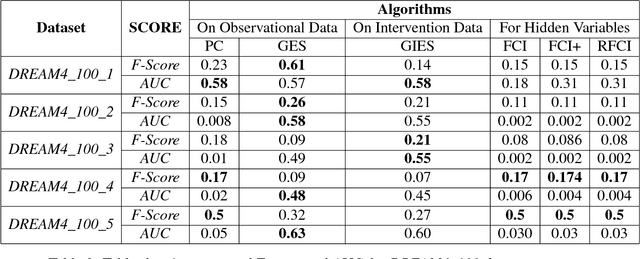
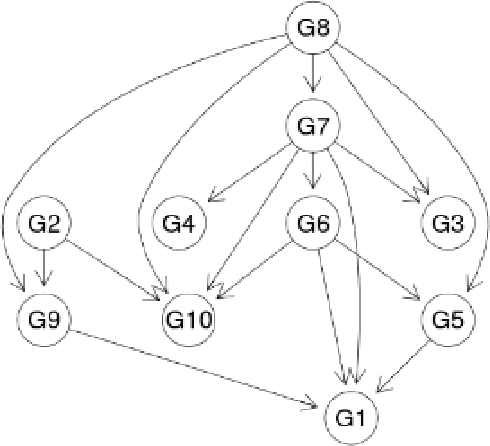
Abstract:In this paper we present a comprehensive view of prominent causal discovery algorithms, categorized into two main categories (1) assuming acyclic and no latent variables, and (2) allowing both cycles and latent variables, along with experimental results comparing them from three perspectives: (a) structural accuracy, (b) standard predictive accuracy, and (c) accuracy of counterfactual inference. For (b) and (c) we train causal Bayesian networks with structures as predicted by each causal discovery technique to carry out counterfactual or standard predictive inference. We compare causal algorithms on two pub- licly available and one simulated datasets having different sample sizes: small, medium and large. Experiments show that structural accuracy of a technique does not necessarily correlate with higher accuracy of inferencing tasks. Fur- ther, surveyed structure learning algorithms do not perform well in terms of structural accuracy in case of datasets having large number of variables.
Deep Convolutional Neural Networks for Pairwise Causality
Jan 03, 2017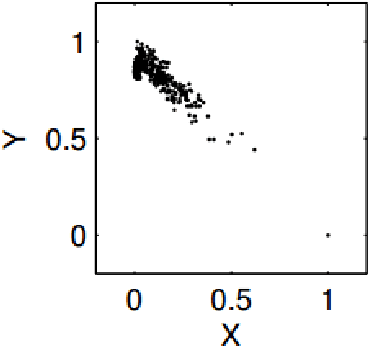


Abstract:Discovering causal models from observational and interventional data is an important first step preceding what-if analysis or counterfactual reasoning. As has been shown before, the direction of pairwise causal relations can, under certain conditions, be inferred from observational data via standard gradient-boosted classifiers (GBC) using carefully engineered statistical features. In this paper we apply deep convolutional neural networks (CNNs) to this problem by plotting attribute pairs as 2-D scatter plots that are fed to the CNN as images. We evaluate our approach on the 'Cause- Effect Pairs' NIPS 2013 Data Challenge. We observe that a weighted ensemble of CNN with the earlier GBC approach yields significant improvement. Further, we observe that when less training data is available, our approach performs better than the GBC based approach suggesting that CNN models pre-trained to determine the direction of pairwise causal direction could have wider applicability in causal discovery and enabling what-if or counterfactual analysis.
Warranty Cost Estimation Using Bayesian Network
Nov 11, 2014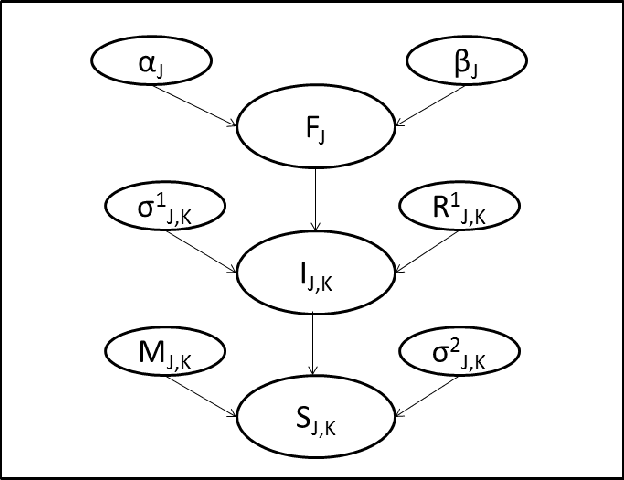


Abstract:All multi-component product manufacturing companies face the problem of warranty cost estimation. Failure rate analysis of components plays a key role in this problem. Data source used for failure rate analysis has traditionally been past failure data of components. However, failure rate analysis can be improved by means of fusion of additional information, such as symptoms observed during after-sale service of the product, geographical information (hilly or plains areas), and information from tele-diagnostic analytics. In this paper, we propose an approach, which learns dependency between part-failures and symptoms gleaned from such diverse sources of information, to predict expected number of failures with better accuracy. We also indicate how the optimum warranty period can be computed. We demonstrate, through empirical results, that our method can improve the warranty cost estimates significantly.
 Add to Chrome
 Add to Firefox
 Add to Edge