Camille Harris
A Material Lens on Coloniality in NLP
Nov 14, 2023Abstract:Coloniality, the continuation of colonial harms beyond "official" colonization, has pervasive effects across society and scientific fields. Natural Language Processing (NLP) is no exception to this broad phenomenon. In this work, we argue that coloniality is implicitly embedded in and amplified by NLP data, algorithms, and software. We formalize this analysis using Actor-Network Theory (ANT): an approach to understanding social phenomena through the network of relationships between human stakeholders and technology. We use our Actor-Network to guide a quantitative survey of the geography of different phases of NLP research, providing evidence that inequality along colonial boundaries increases as NLP builds on itself. Based on this, we argue that combating coloniality in NLP requires not only changing current values but also active work to remove the accumulation of colonial ideals in our foundational data and algorithms.
VALUE: Understanding Dialect Disparity in NLU
Apr 06, 2022

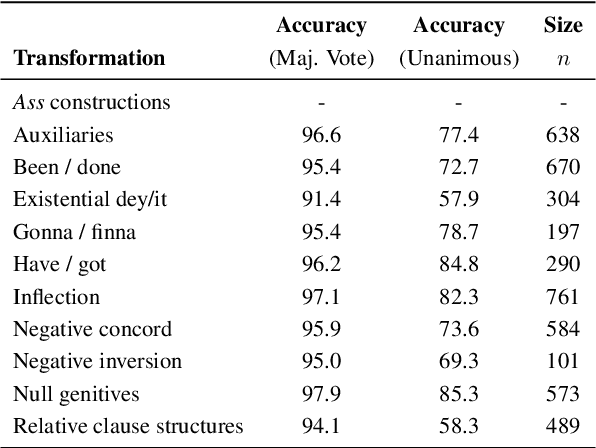

Abstract:English Natural Language Understanding (NLU) systems have achieved great performances and even outperformed humans on benchmarks like GLUE and SuperGLUE. However, these benchmarks contain only textbook Standard American English (SAE). Other dialects have been largely overlooked in the NLP community. This leads to biased and inequitable NLU systems that serve only a sub-population of speakers. To understand disparities in current models and to facilitate more dialect-competent NLU systems, we introduce the VernAcular Language Understanding Evaluation (VALUE) benchmark, a challenging variant of GLUE that we created with a set of lexical and morphosyntactic transformation rules. In this initial release (V.1), we construct rules for 11 features of African American Vernacular English (AAVE), and we recruit fluent AAVE speakers to validate each feature transformation via linguistic acceptability judgments in a participatory design manner. Experiments show that these new dialectal features can lead to a drop in model performance.
Mitigating Racial Biases in Toxic Language Detection with an Equity-Based Ensemble Framework
Sep 27, 2021
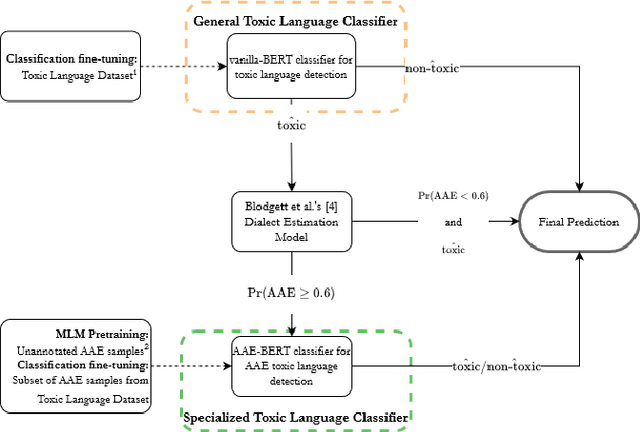
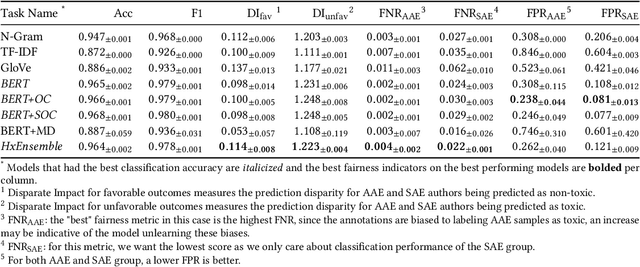

Abstract:Recent research has demonstrated how racial biases against users who write African American English exists in popular toxic language datasets. While previous work has focused on a single fairness criteria, we propose to use additional descriptive fairness metrics to better understand the source of these biases. We demonstrate that different benchmark classifiers, as well as two in-process bias-remediation techniques, propagate racial biases even in a larger corpus. We then propose a novel ensemble-framework that uses a specialized classifier that is fine-tuned to the African American English dialect. We show that our proposed framework substantially reduces the racial biases that the model learns from these datasets. We demonstrate how the ensemble framework improves fairness metrics across all sample datasets with minimal impact on the classification performance, and provide empirical evidence in its ability to unlearn the annotation biases towards authors who use African American English. ** Please note that this work may contain examples of offensive words and phrases.
Insight-centric Visualization Recommendation
Mar 21, 2021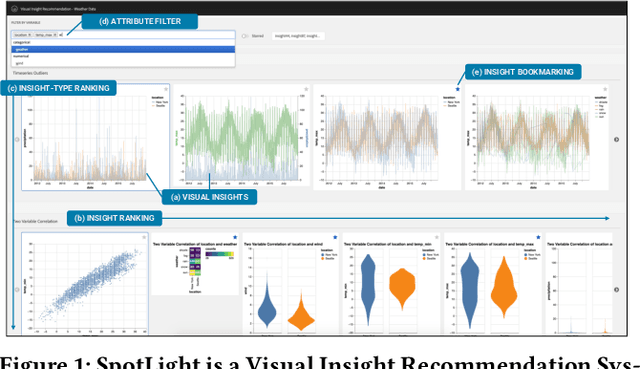
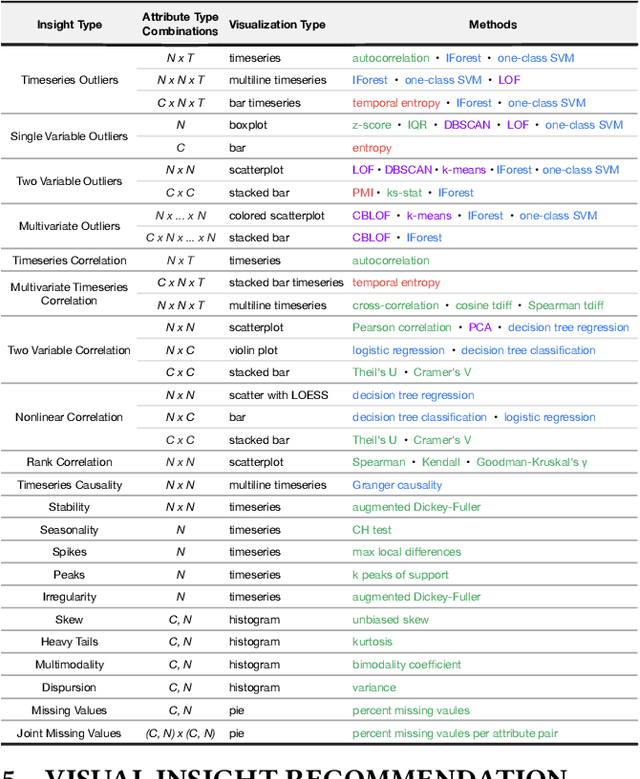

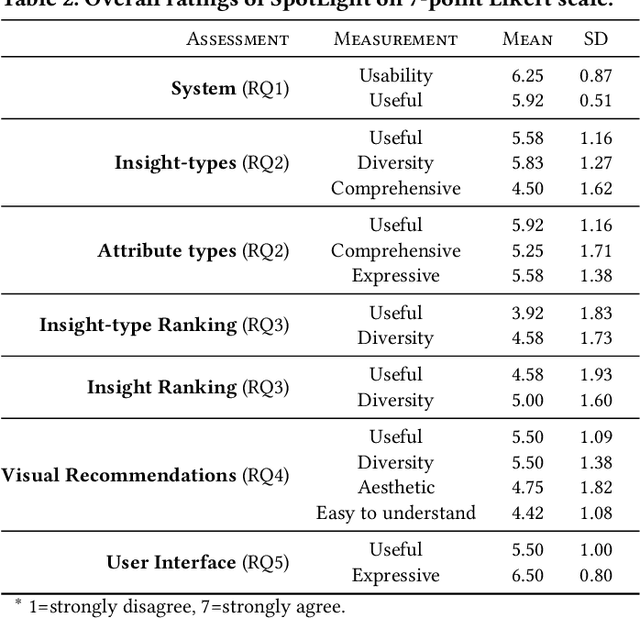
Abstract:Visualization recommendation systems simplify exploratory data analysis (EDA) and make understanding data more accessible to users of all skill levels by automatically generating visualizations for users to explore. However, most existing visualization recommendation systems focus on ranking all visualizations into a single list or set of groups based on particular attributes or encodings. This global ranking makes it difficult and time-consuming for users to find the most interesting or relevant insights. To address these limitations, we introduce a novel class of visualization recommendation systems that automatically rank and recommend both groups of related insights as well as the most important insights within each group. Our proposed approach combines results from many different learning-based methods to discover insights automatically. A key advantage is that this approach generalizes to a wide variety of attribute types such as categorical, numerical, and temporal, as well as complex non-trivial combinations of these different attribute types. To evaluate the effectiveness of our approach, we implemented a new insight-centric visualization recommendation system, SpotLight, which generates and ranks annotated visualizations to explain each insight. We conducted a user study with 12 participants and two datasets which showed that users are able to quickly understand and find relevant insights in unfamiliar data.
 Add to Chrome
 Add to Firefox
 Add to Edge