Wookjin Choi
Regional Attention-Enhanced Swin Transformer for Clinically Relevant Medical Image Captioning
Nov 13, 2025Abstract:Automated medical image captioning translates complex radiological images into diagnostic narratives that can support reporting workflows. We present a Swin-BART encoder-decoder system with a lightweight regional attention module that amplifies diagnostically salient regions before cross-attention. Trained and evaluated on ROCO, our model achieves state-of-the-art semantic fidelity while remaining compact and interpretable. We report results as mean$\pm$std over three seeds and include $95\%$ confidence intervals. Compared with baselines, our approach improves ROUGE (proposed 0.603, ResNet-CNN 0.356, BLIP2-OPT 0.255) and BERTScore (proposed 0.807, BLIP2-OPT 0.645, ResNet-CNN 0.623), with competitive BLEU, CIDEr, and METEOR. We further provide ablations (regional attention on/off and token-count sweep), per-modality analysis (CT/MRI/X-ray), paired significance tests, and qualitative heatmaps that visualize the regions driving each description. Decoding uses beam search (beam size $=4$), length penalty $=1.1$, $no\_repeat\_ngram\_size$ $=3$, and max length $=128$. The proposed design yields accurate, clinically phrased captions and transparent regional attributions, supporting safe research use with a human in the loop.
CIRDataset: A large-scale Dataset for Clinically-Interpretable lung nodule Radiomics and malignancy prediction
Jun 29, 2022


Abstract:Spiculations/lobulations, sharp/curved spikes on the surface of lung nodules, are good predictors of lung cancer malignancy and hence, are routinely assessed and reported by radiologists as part of the standardized Lung-RADS clinical scoring criteria. Given the 3D geometry of the nodule and 2D slice-by-slice assessment by radiologists, manual spiculation/lobulation annotation is a tedious task and thus no public datasets exist to date for probing the importance of these clinically-reported features in the SOTA malignancy prediction algorithms. As part of this paper, we release a large-scale Clinically-Interpretable Radiomics Dataset, CIRDataset, containing 956 radiologist QA/QC'ed spiculation/lobulation annotations on segmented lung nodules from two public datasets, LIDC-IDRI (N=883) and LUNGx (N=73). We also present an end-to-end deep learning model based on multi-class Voxel2Mesh extension to segment nodules (while preserving spikes), classify spikes (sharp/spiculation and curved/lobulation), and perform malignancy prediction. Previous methods have performed malignancy prediction for LIDC and LUNGx datasets but without robust attribution to any clinically reported/actionable features (due to known hyperparameter sensitivity issues with general attribution schemes). With the release of this comprehensively-annotated CIRDataset and end-to-end deep learning baseline, we hope that malignancy prediction methods can validate their explanations, benchmark against our baseline, and provide clinically-actionable insights. Dataset, code, pretrained models, and docker containers are available at https://github.com/nadeemlab/CIR.
OARnet: Automated organs-at-risk delineation in Head and Neck CT images
Aug 31, 2021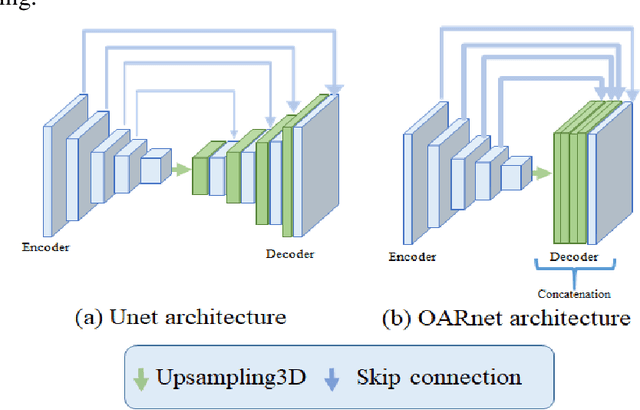
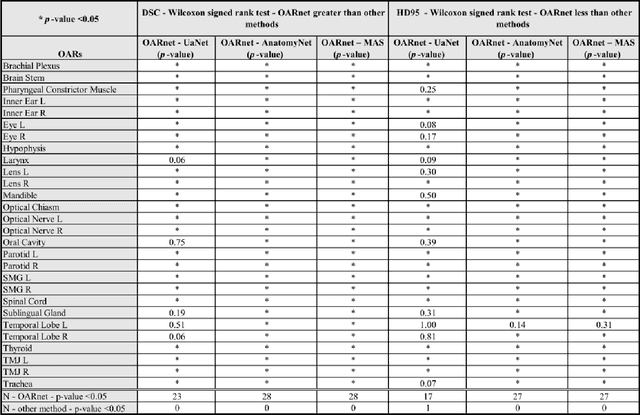
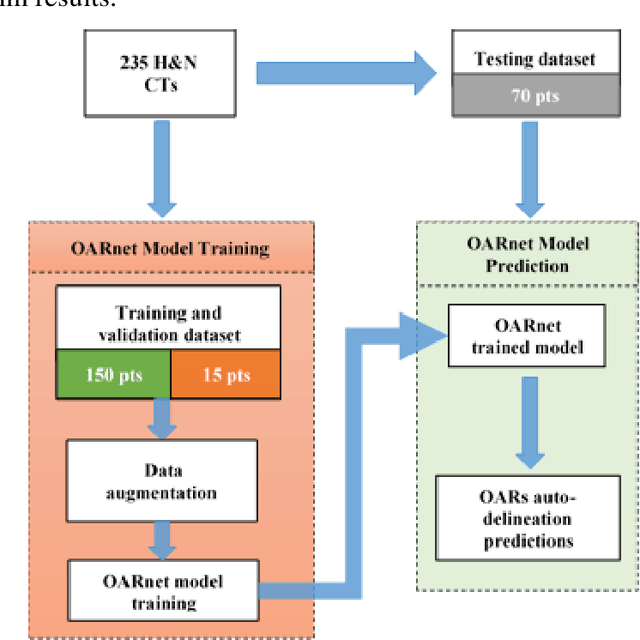
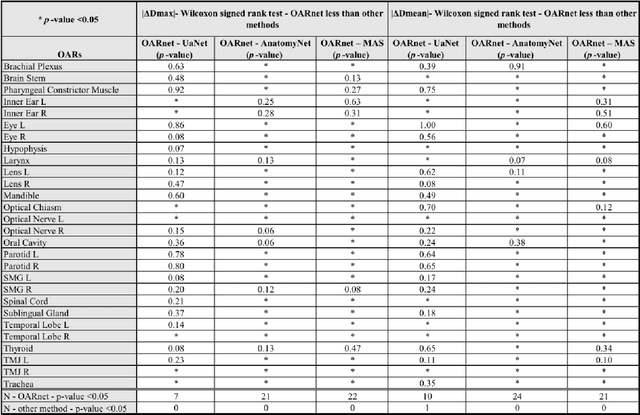
Abstract:A 3D deep learning model (OARnet) is developed and used to delineate 28 H&N OARs on CT images. OARnet utilizes a densely connected network to detect the OAR bounding-box, then delineates the OAR within the box. It reuses information from any layer to subsequent layers and uses skip connections to combine information from different dense block levels to progressively improve delineation accuracy. Training uses up to 28 expert manual delineated (MD) OARs from 165 CTs. Dice similarity coefficient (DSC) and the 95th percentile Hausdorff distance (HD95) with respect to MD is assessed for 70 other CTs. Mean, maximum, and root-mean-square dose differences with respect to MD are assessed for 56 of the 70 CTs. OARnet is compared with UaNet, AnatomyNet, and Multi-Atlas Segmentation (MAS). Wilcoxon signed-rank tests using 95% confidence intervals are used to assess significance. Wilcoxon signed ranked tests show that, compared with UaNet, OARnet improves (p<0.05) the DSC (23/28 OARs) and HD95 (17/28). OARnet outperforms both AnatomyNet and MAS for DSC (28/28) and HD95 (27/28). Compared with UaNet, OARnet improves median DSC up to 0.05 and HD95 up to 1.5mm. Compared with AnatomyNet and MAS, OARnet improves median (DSC, HD95) by up to (0.08, 2.7mm) and (0.17, 6.3mm). Dosimetrically, OARnet outperforms UaNet (Dmax 7/28; Dmean 10/28), AnatomyNet (Dmax 21/28; Dmean 24/28), and MAS (Dmax 22/28; Dmean 21/28). The DenseNet architecture is optimized using a hybrid approach that performs OAR-specific bounding box detection followed by feature recognition. Compared with other auto-delineation methods, OARnet is better than or equal to UaNet for all but one geometric (Temporal Lobe L, HD95) and one dosimetric (Eye L, mean dose) endpoint for the 28 H&N OARs, and is better than or equal to both AnatomyNet and MAS for all OARs.
Unsupervised Learning of Deep-Learned Features from Breast Cancer Images
Jun 21, 2020


Abstract:Detecting cancer manually in whole slide images requires significant time and effort on the laborious process. Recent advances in whole slide image analysis have stimulated the growth and development of machine learning-based approaches that improve the efficiency and effectiveness in the diagnosis of cancer diseases. In this paper, we propose an unsupervised learning approach for detecting cancer in breast invasive carcinoma (BRCA) whole slide images. The proposed method is fully automated and does not require human involvement during the unsupervised learning procedure. We demonstrate the effectiveness of the proposed approach for cancer detection in BRCA and show how the machine can choose the most appropriate clusters during the unsupervised learning procedure. Moreover, we present a prototype application that enables users to select relevant groups mapping all regions related to the groups in whole slide images.
Interpretable Spiculation Quantification for Lung Cancer Screening
Sep 01, 2018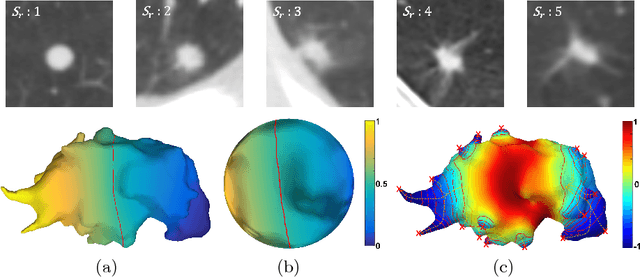
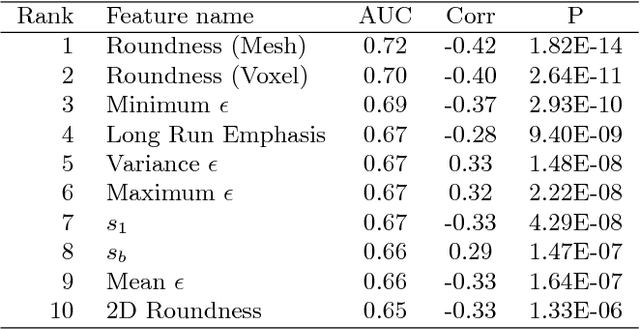
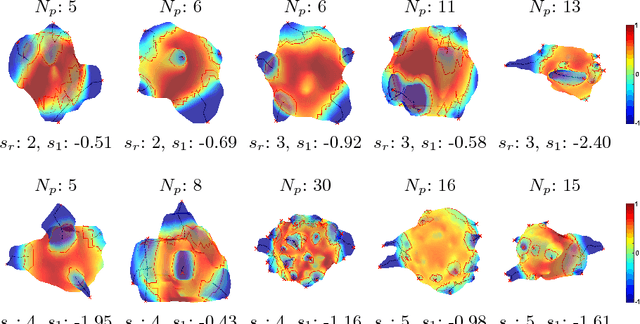

Abstract:Spiculations are spikes on the surface of pulmonary nodule and are important predictors of malignancy in lung cancer. In this work, we introduced an interpretable, parameter-free technique for quantifying this critical feature using the area distortion metric from the spherical conformal (angle-preserving) parameterization. The conformal factor in the spherical mapping formulation provides a direct measure of spiculation which can be used to detect spikes and compute spike heights for geometrically-complex spiculations. The use of the area distortion metric from conformal mapping has never been exploited before in this context. Based on the area distortion metric and the spiculation height, we introduced a novel spiculation score. A combination of our spiculation measures was found to be highly correlated (Spearman's rank correlation coefficient $\rho = 0.48$) with the radiologist's spiculation score. These measures were also used in the radiomics framework to achieve state-of-the-art malignancy prediction accuracy of 88.9% on a publicly available dataset.
Quantification of Local Metabolic Tumor Volume Changes by Registering Blended PET-CT Images for Prediction of Pathologic Tumor Response
Aug 24, 2018


Abstract:Quantification of local metabolic tumor volume (MTV) chan-ges after Chemo-radiotherapy would allow accurate tumor response evaluation. Currently, local MTV changes in esophageal (soft-tissue) cancer are measured by registering follow-up PET to baseline PET using the same transformation obtained by deformable registration of follow-up CT to baseline CT. Such approach is suboptimal because PET and CT capture fundamentally different properties (metabolic vs. anatomy) of a tumor. In this work we combined PET and CT images into a single blended PET-CT image and registered follow-up blended PET-CT image to baseline blended PET-CT image. B-spline regularized diffeomorphic registration was used to characterize the large MTV shrinkage. Jacobian of the resulting transformation was computed to measure the local MTV changes. Radiomic features (intensity and texture) were then extracted from the Jacobian map to predict pathologic tumor response. Local MTV changes calculated using blended PET-CT registration achieved the highest correlation with ground truth segmentation (R=0.88) compared to PET-PET (R=0.80) and CT-CT (R=0.67) registrations. Moreover, using blended PET-CT registration, the multivariate prediction model achieved the highest accuracy with only one Jacobian co-occurrence texture feature (accuracy=82.3%). This novel framework can replace the conventional approach that applies CT-CT transformation to the PET data for longitudinal evaluation of tumor response.
 Add to Chrome
 Add to Firefox
 Add to Edge