Thomas Höllt
AI-in-the-loop: The future of biomedical visual analytics applications in the era of AI
Dec 20, 2024


Abstract:AI is the workhorse of modern data analytics and omnipresent across many sectors. Large Language Models and multi-modal foundation models are today capable of generating code, charts, visualizations, etc. How will these massive developments of AI in data analytics shape future data visualizations and visual analytics workflows? What is the potential of AI to reshape methodology and design of future visual analytics applications? What will be our role as visualization researchers in the future? What are opportunities, open challenges and threats in the context of an increasingly powerful AI? This Visualization Viewpoint discusses these questions in the special context of biomedical data analytics as an example of a domain in which critical decisions are taken based on complex and sensitive data, with high requirements on transparency, efficiency, and reliability. We map recent trends and developments in AI on the elements of interactive visualization and visual analytics workflows and highlight the potential of AI to transform biomedical visualization as a research field. Given that agency and responsibility have to remain with human experts, we argue that it is helpful to keep the focus on human-centered workflows, and to use visual analytics as a tool for integrating ``AI-in-the-loop''. This is in contrast to the more traditional term ``human-in-the-loop'', which focuses on incorporating human expertise into AI-based systems.
Accelerating hyperbolic t-SNE
Jan 23, 2024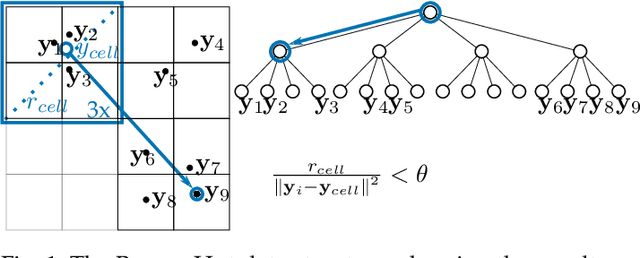
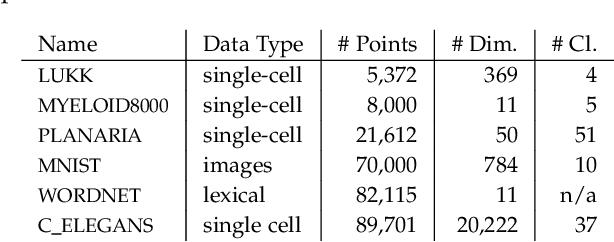
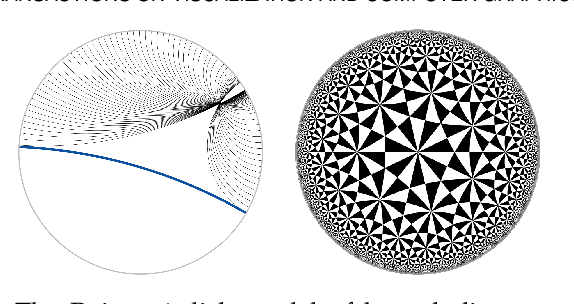
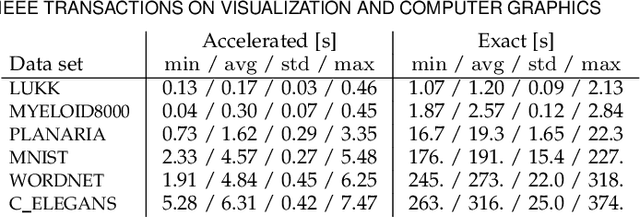
Abstract:The need to understand the structure of hierarchical or high-dimensional data is present in a variety of fields. Hyperbolic spaces have proven to be an important tool for embedding computations and analysis tasks as their non-linear nature lends itself well to tree or graph data. Subsequently, they have also been used in the visualization of high-dimensional data, where they exhibit increased embedding performance. However, none of the existing dimensionality reduction methods for embedding into hyperbolic spaces scale well with the size of the input data. That is because the embeddings are computed via iterative optimization schemes and the computation cost of every iteration is quadratic in the size of the input. Furthermore, due to the non-linear nature of hyperbolic spaces, Euclidean acceleration structures cannot directly be translated to the hyperbolic setting. This paper introduces the first acceleration structure for hyperbolic embeddings, building upon a polar quadtree. We compare our approach with existing methods and demonstrate that it computes embeddings of similar quality in significantly less time. Implementation and scripts for the experiments can be found at https://graphics.tudelft.nl/accelerating-hyperbolic-tsne.
Tuning the perplexity for and computing sampling-based t-SNE embeddings
Aug 29, 2023


Abstract:Widely used pipelines for the analysis of high-dimensional data utilize two-dimensional visualizations. These are created, e.g., via t-distributed stochastic neighbor embedding (t-SNE). When it comes to large data sets, applying these visualization techniques creates suboptimal embeddings, as the hyperparameters are not suitable for large data. Cranking up these parameters usually does not work as the computations become too expensive for practical workflows. In this paper, we argue that a sampling-based embedding approach can circumvent these problems. We show that hyperparameters must be chosen carefully, depending on the sampling rate and the intended final embedding. Further, we show how this approach speeds up the computation and increases the quality of the embeddings.
Incorporating Texture Information into Dimensionality Reduction for High-Dimensional Images
Mar 02, 2022
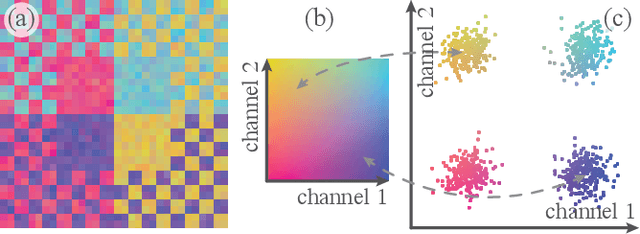
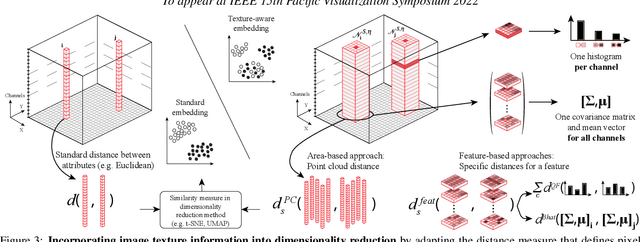

Abstract:High-dimensional imaging is becoming increasingly relevant in many fields from astronomy and cultural heritage to systems biology. Visual exploration of such high-dimensional data is commonly facilitated by dimensionality reduction. However, common dimensionality reduction methods do not include spatial information present in images, such as local texture features, into the construction of low-dimensional embeddings. Consequently, exploration of such data is typically split into a step focusing on the attribute space followed by a step focusing on spatial information, or vice versa. In this paper, we present a method for incorporating spatial neighborhood information into distance-based dimensionality reduction methods, such as t-Distributed Stochastic Neighbor Embedding (t-SNE). We achieve this by modifying the distance measure between high-dimensional attribute vectors associated with each pixel such that it takes the pixel's spatial neighborhood into account. Based on a classification of different methods for comparing image patches, we explore a number of different approaches. We compare these approaches from a theoretical and experimental point of view. Finally, we illustrate the value of the proposed methods by qualitative and quantitative evaluation on synthetic data and two real-world use cases.
Approximated and User Steerable tSNE for Progressive Visual Analytics
Jun 16, 2016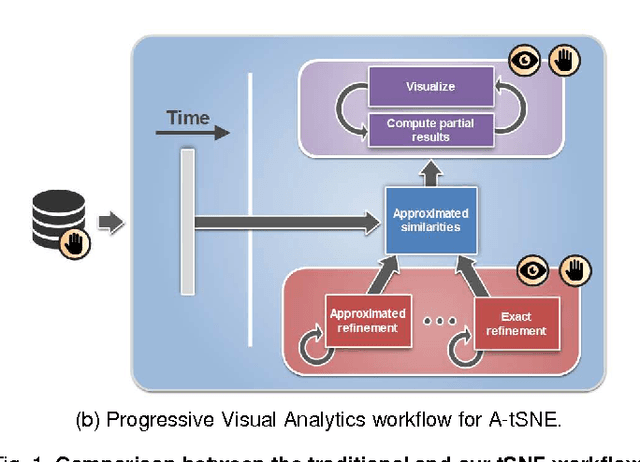

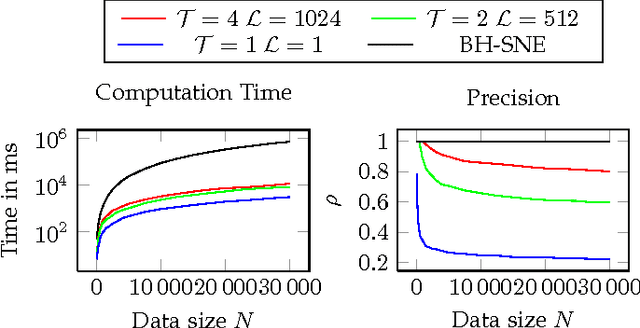
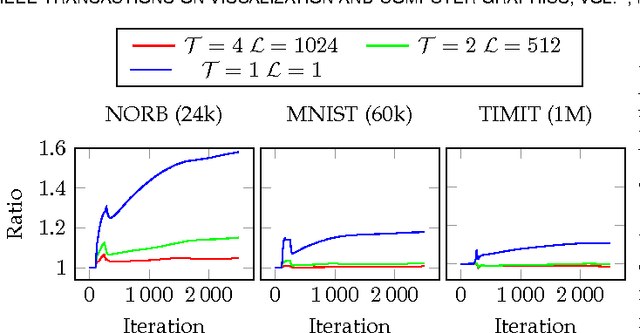
Abstract:Progressive Visual Analytics aims at improving the interactivity in existing analytics techniques by means of visualization as well as interaction with intermediate results. One key method for data analysis is dimensionality reduction, for example, to produce 2D embeddings that can be visualized and analyzed efficiently. t-Distributed Stochastic Neighbor Embedding (tSNE) is a well-suited technique for the visualization of several high-dimensional data. tSNE can create meaningful intermediate results but suffers from a slow initialization that constrains its application in Progressive Visual Analytics. We introduce a controllable tSNE approximation (A-tSNE), which trades off speed and accuracy, to enable interactive data exploration. We offer real-time visualization techniques, including a density-based solution and a Magic Lens to inspect the degree of approximation. With this feedback, the user can decide on local refinements and steer the approximation level during the analysis. We demonstrate our technique with several datasets, in a real-world research scenario and for the real-time analysis of high-dimensional streams to illustrate its effectiveness for interactive data analysis.
 Add to Chrome
 Add to Firefox
 Add to Edge