Miguel O. Bernabeu
Comparative evaluation of training strategies using partially labelled datasets for segmentation of white matter hyperintensities and stroke lesions in FLAIR MRI
Jan 28, 2026Abstract:White matter hyperintensities (WMH) and ischaemic stroke lesions (ISL) are imaging features associated with cerebral small vessel disease (SVD) that are visible on brain magnetic resonance imaging (MRI) scans. The development and validation of deep learning models to segment and differentiate these features is difficult because they visually confound each other in the fluid-attenuated inversion recovery (FLAIR) sequence and often appear in the same subject. We investigated six strategies for training a combined WMH and ISL segmentation model using partially labelled data. We combined privately held fully and partially labelled datasets with publicly available partially labelled datasets to yield a total of 2052 MRI volumes, with 1341 and 1152 containing ground truth annotations for WMH and ISL respectively. We found that several methods were able to effectively leverage the partially labelled data to improve model performance, with the use of pseudolabels yielding the best result.
Uncertainty quantification for White Matter Hyperintensity segmentation detects silent failures and improves automated Fazekas quantification
Nov 26, 2024Abstract:White Matter Hyperintensities (WMH) are key neuroradiological markers of small vessel disease present in brain MRI. Assessment of WMH is important in research and clinics. However, WMH are challenging to segment due to their high variability in shape, location, size, poorly defined borders, and similar intensity profile to other pathologies (e.g stroke lesions) and artefacts (e.g head motion). In this work, we apply the most effective techniques for uncertainty quantification (UQ) in segmentation to the WMH segmentation task across multiple test-time data distributions. We find a combination of Stochastic Segmentation Networks with Deep Ensembles yields the highest Dice and lowest Absolute Volume Difference % (AVD) score on in-domain and out-of-distribution data. We demonstrate the downstream utility of UQ, proposing a novel method for classification of the clinical Fazekas score using spatial features extracted for WMH segmentation and UQ maps. We show that incorporating WMH uncertainty information improves Fazekas classification performance and calibration, with median class balanced accuracy for classification models with (UQ and spatial WMH features)/(spatial WMH features)/(WMH volume only) of 0.71/0.66/0.60 in the Deep WMH and 0.82/0.77/0.73 in the Periventricular WMH regions respectively. We demonstrate that stochastic UQ techniques with high sample diversity can improve the detection of poor quality segmentations. Finally, we qualitatively analyse the semantic information captured by UQ techniques and demonstrate that uncertainty can highlight areas where there is ambiguity between WMH and stroke lesions, while identifying clusters of small WMH in deep white matter unsegmented by the model.
Automated neuroradiological support systems for multiple cerebrovascular disease markers -- A systematic review and meta-analysis
Oct 22, 2024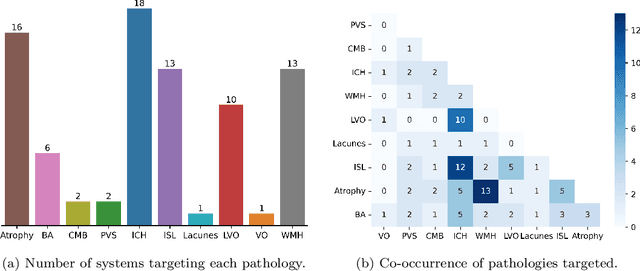
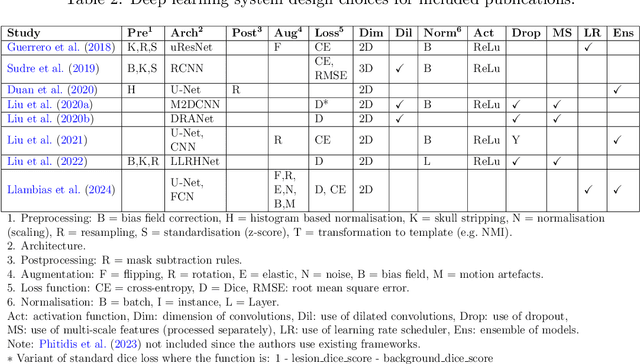
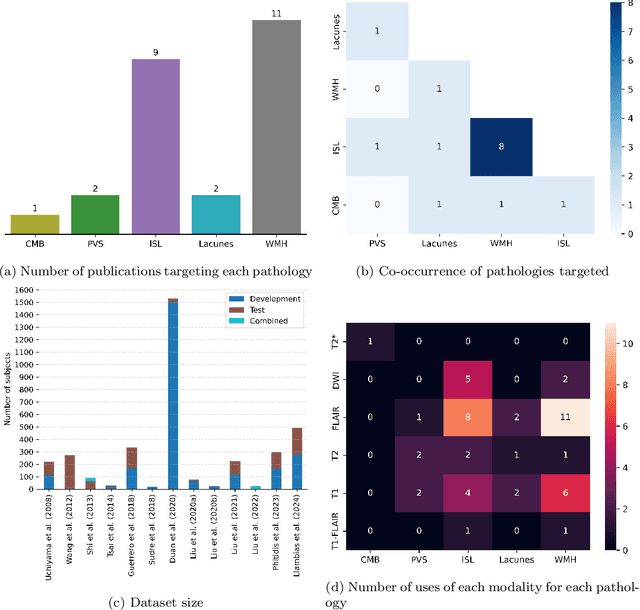
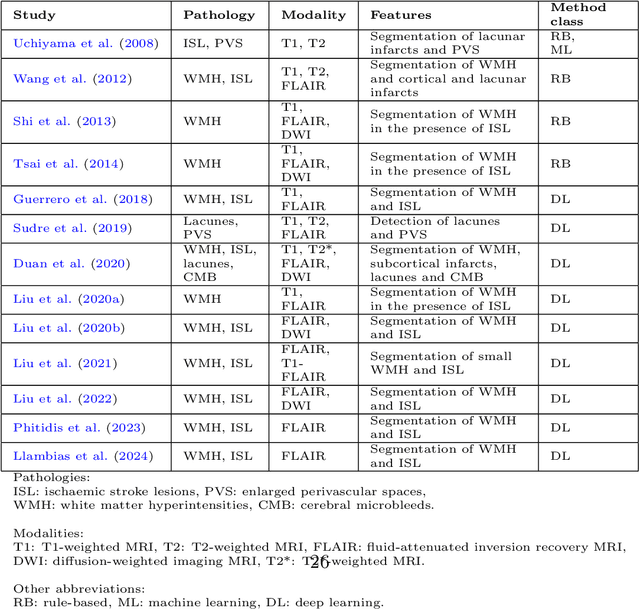
Abstract:Cerebrovascular diseases (CVD) can lead to stroke and dementia. Stroke is the second leading cause of death world wide and dementia incidence is increasing by the year. There are several markers of CVD that are visible on brain imaging, including: white matter hyperintensities (WMH), acute and chronic ischaemic stroke lesions (ISL), lacunes, enlarged perivascular spaces (PVS), acute and chronic haemorrhagic lesions, and cerebral microbleeds (CMB). Brain atrophy also occurs in CVD. These markers are important for patient management and intervention, since they indicate elevated risk of future stroke and dementia. We systematically reviewed automated systems designed to support radiologists reporting on these CVD imaging findings. We considered commercially available software and research publications which identify at least two CVD markers. In total, we included 29 commercial products and 13 research publications. Two distinct types of commercial support system were available: those which identify acute stroke lesions (haemorrhagic and ischaemic) from computed tomography (CT) scans, mainly for the purpose of patient triage; and those which measure WMH and atrophy regionally and longitudinally. In research, WMH and ISL were the markers most frequently analysed together, from magnetic resonance imaging (MRI) scans; lacunes and PVS were each targeted only twice and CMB only once. For stroke, commercially available systems largely support the emergency setting, whilst research systems consider also follow-up and routine scans. The systems to quantify WMH and atrophy are focused on neurodegenerative disease support, where these CVD markers are also of significance. There are currently no openly validated systems, commercially, or in research, performing a comprehensive joint analysis of all CVD markers (WMH, ISL, lacunes, PVS, haemorrhagic lesions, CMB, and atrophy).
Domain-specific augmentations with resolution agnostic self-attention mechanism improves choroid segmentation in optical coherence tomography images
May 23, 2024

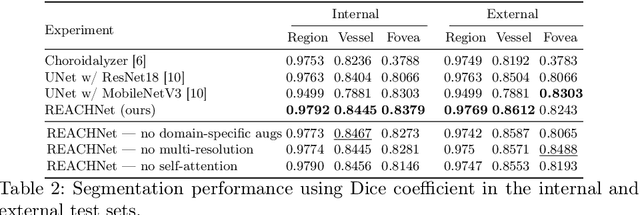
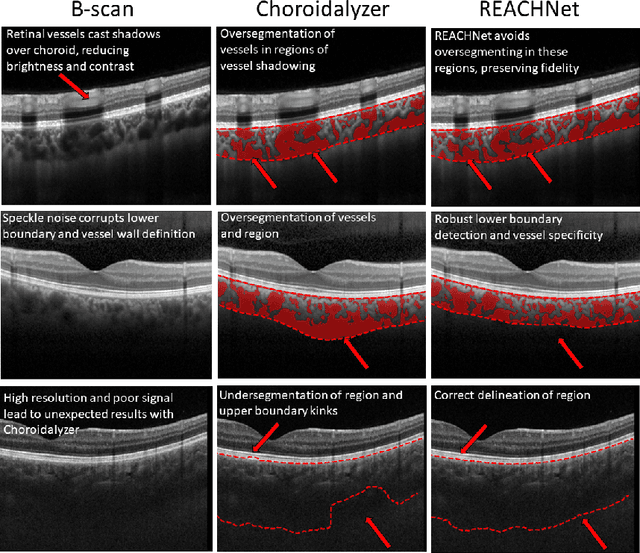
Abstract:The choroid is a key vascular layer of the eye, supplying oxygen to the retinal photoreceptors. Non-invasive enhanced depth imaging optical coherence tomography (EDI-OCT) has recently improved access and visualisation of the choroid, making it an exciting frontier for discovering novel vascular biomarkers in ophthalmology and wider systemic health. However, current methods to measure the choroid often require use of multiple, independent semi-automatic and deep learning-based algorithms which are not made open-source. Previously, Choroidalyzer -- an open-source, fully automatic deep learning method trained on 5,600 OCT B-scans from 385 eyes -- was developed to fully segment and quantify the choroid in EDI-OCT images, thus addressing these issues. Using the same dataset, we propose a Robust, Resolution-agnostic and Efficient Attention-based network for CHoroid segmentation (REACH). REACHNet leverages multi-resolution training with domain-specific data augmentation to promote generalisation, and uses a lightweight architecture with resolution-agnostic self-attention which is not only faster than Choroidalyzer's previous network (4 images/s vs. 2.75 images/s on a standard laptop CPU), but has greater performance for segmenting the choroid region, vessels and fovea (Dice coefficient for region 0.9769 vs. 0.9749, vessels 0.8612 vs. 0.8192 and fovea 0.8243 vs. 0.3783) due to its improved hyperparameter configuration and model training pipeline. REACHNet can be used with Choroidalyzer as a drop-in replacement for the original model and will be made available upon publication.
Training a high-performance retinal foundation model with half-the-data and 400 times less compute
Apr 30, 2024Abstract:Artificial Intelligence holds tremendous potential in medicine, but is traditionally limited by the lack of massive datasets to train models on. Foundation models, pre-trained models that can be adapted to downstream tasks with small datasets, could alleviate this problem. Researchers at Moorfields Eye Hospital (MEH) proposed RETFound-MEH, a foundation model for retinal imaging that was trained on 900,000 images, including private hospital data. Recently, data-efficient DERETFound was proposed that provides comparable performance while being trained on only 150,000 images that are all publicly available. However, both these models required very substantial resources to train initially and are resource-intensive in downstream use. We propose a novel Token Reconstruction objective that we use to train RETFound-Green, a retinal foundation model trained using only 75,000 publicly available images and 400 times less compute. We estimate the cost of training RETFound-MEH and DERETFound at $10,000 and $14,000, respectively, while RETFound-Green could be trained for less than $100, with equally reduced environmental impact. RETFound-Green is also far more efficient in downstream use: it can be downloaded 14 times faster, computes vector embeddings 2.7 times faster which then require 2.6 times less storage space. Despite this, RETFound-Green does not perform systematically worse. In fact, it performs best on 14 tasks, compared to six for DERETFound and two for RETFound-MEH. Our results suggest that RETFound-Green is a very efficient, high-performance retinal foundation model. We anticipate that our Token Reconstruction objective could be scaled up for even higher performance and be applied to other domains beyond retinal imaging.
Applicability of oculomics for individual risk prediction: Repeatability and robustness of retinal Fractal Dimension using DART and AutoMorph
Mar 11, 2024Abstract:Purpose: To investigate whether Fractal Dimension (FD)-based oculomics could be used for individual risk prediction by evaluating repeatability and robustness. Methods: We used two datasets: Caledonia, healthy adults imaged multiple times in quick succession for research (26 subjects, 39 eyes, 377 colour fundus images), and GRAPE, glaucoma patients with baseline and follow-up visits (106 subjects, 196 eyes, 392 images). Mean follow-up time was 18.3 months in GRAPE, thus it provides a pessimistic lower-bound as vasculature could change. FD was computed with DART and AutoMorph. Image quality was assessed with QuickQual, but no images were initially excluded. Pearson, Spearman, and Intraclass Correlation (ICC) were used for population-level repeatability. For individual-level repeatability, we introduce measurement noise parameter {\lambda} which is within-eye Standard Deviation (SD) of FD measurements in units of between-eyes SD. Results: In Caledonia, ICC was 0.8153 for DART and 0.5779 for AutoMorph, Pearson/Spearman correlation (first and last image) 0.7857/0.7824 for DART, and 0.3933/0.6253 for AutoMorph. In GRAPE, Pearson/Spearman correlation (first and next visit) was 0.7479/0.7474 for DART, and 0.7109/0.7208 for AutoMorph (all p<0.0001). Median {\lambda} in Caledonia without exclusions was 3.55\% for DART and 12.65\% for AutoMorph, and improved to up to 1.67\% and 6.64\% with quality-based exclusions, respectively. Quality exclusions primarily mitigated large outliers. Worst quality in an eye correlated strongly with {\lambda} (Pearson 0.5350-0.7550, depending on dataset and method, all p<0.0001). Conclusions: Repeatability was sufficient for individual-level predictions in heterogeneous populations. DART performed better on all metrics and might be able to detect small, longitudinal changes, highlighting the potential of robust methods.
Choroidalyzer: An open-source, end-to-end pipeline for choroidal analysis in optical coherence tomography
Dec 05, 2023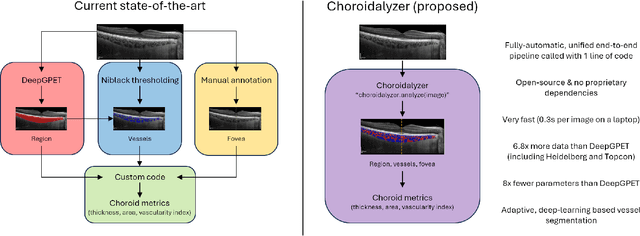


Abstract:Purpose: To develop Choroidalyzer, an open-source, end-to-end pipeline for segmenting the choroid region, vessels, and fovea, and deriving choroidal thickness, area, and vascular index. Methods: We used 5,600 OCT B-scans (233 subjects, 6 systemic disease cohorts, 3 device types, 2 manufacturers). To generate region and vessel ground-truths, we used state-of-the-art automatic methods following manual correction of inaccurate segmentations, with foveal positions manually annotated. We trained a U-Net deep-learning model to detect the region, vessels, and fovea to calculate choroid thickness, area, and vascular index in a fovea-centred region of interest. We analysed segmentation agreement (AUC, Dice) and choroid metrics agreement (Pearson, Spearman, mean absolute error (MAE)) in internal and external test sets. We compared Choroidalyzer to two manual graders on a small subset of external test images and examined cases of high error. Results: Choroidalyzer took 0.299 seconds per image on a standard laptop and achieved excellent region (Dice: internal 0.9789, external 0.9749), very good vessel segmentation performance (Dice: internal 0.8817, external 0.8703) and excellent fovea location prediction (MAE: internal 3.9 pixels, external 3.4 pixels). For thickness, area, and vascular index, Pearson correlations were 0.9754, 0.9815, and 0.8285 (internal) / 0.9831, 0.9779, 0.7948 (external), respectively (all p<0.0001). Choroidalyzer's agreement with graders was comparable to the inter-grader agreement across all metrics. Conclusions: Choroidalyzer is an open-source, end-to-end pipeline that accurately segments the choroid and reliably extracts thickness, area, and vascular index. Especially choroidal vessel segmentation is a difficult and subjective task, and fully-automatic methods like Choroidalyzer could provide objectivity and standardisation.
QuickQual: Lightweight, convenient retinal image quality scoring with off-the-shelf pretrained models
Jul 25, 2023Abstract:Image quality remains a key problem for both traditional and deep learning (DL)-based approaches to retinal image analysis, but identifying poor quality images can be time consuming and subjective. Thus, automated methods for retinal image quality scoring (RIQS) are needed. The current state-of-the-art is MCFNet, composed of three Densenet121 backbones each operating in a different colour space. MCFNet, and the EyeQ dataset released by the same authors, was a huge step forward for RIQS. We present QuickQual, a simple approach to RIQS, consisting of a single off-the-shelf ImageNet-pretrained Densenet121 backbone plus a Support Vector Machine (SVM). QuickQual performs very well, setting a new state-of-the-art for EyeQ (Accuracy: 88.50% vs 88.00% for MCFNet; AUC: 0.9687 vs 0.9588). This suggests that RIQS can be solved with generic perceptual features learned on natural images, as opposed to requiring DL models trained on large amounts of fundus images. Additionally, we propose a Fixed Prior linearisation scheme, that converts EyeQ from a 3-way classification to a continuous logistic regression task. For this task, we present a second model, QuickQual MEga Minified Estimator (QuickQual-MEME), that consists of only 10 parameters on top of an off-the-shelf Densenet121 and can distinguish between gradable and ungradable images with an accuracy of 89.18% (AUC: 0.9537). Code and model are available on GitHub: https://github.com/justinengelmann/QuickQual . QuickQual is so lightweight, that the entire inference code (and even the parameters for QuickQual-MEME) is already contained in this paper.
Efficient and fully-automatic retinal choroid segmentation in OCT through DL-based distillation of a hand-crafted pipeline
Jul 03, 2023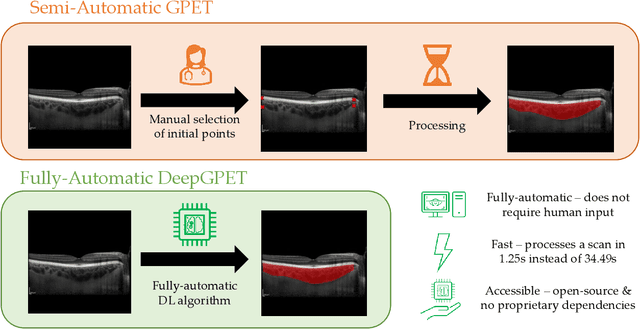
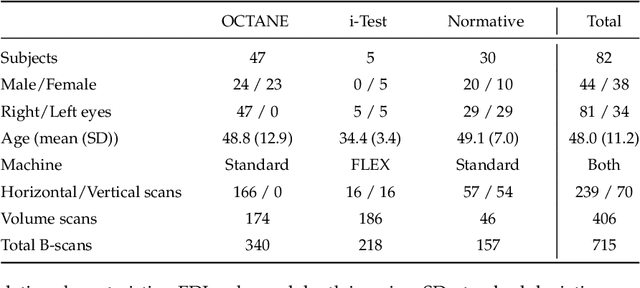

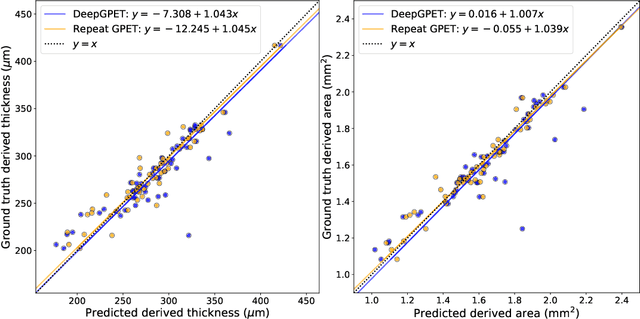
Abstract:Retinal vascular phenotypes, derived from low-cost, non-invasive retinal imaging, have been linked to systemic conditions such as cardio-, neuro- and reno-vascular disease. Recent high-resolution optical coherence tomography (OCT) allows imaging of the choroidal microvasculature which could provide more information about vascular health that complements the superficial retinal vessels, which current vascular phenotypes are based on. Segmentation of the choroid in OCT is a key step in quantifying choroidal parameters like thickness and area. Gaussian Process Edge Tracing (GPET) is a promising, clinically validated method for this. However, GPET is semi-automatic and thus requires time-consuming manual interventions by specifically trained personnel which introduces subjectivity and limits the potential for analysing larger datasets or deploying GPET into clinical practice. We introduce DeepGPET, which distils GPET into a neural network to yield a fully-automatic and efficient choroidal segmentation method. DeepGPET achieves excellent agreement with GPET on data from 3 clinical studies (AUC=0.9994, Dice=0.9664; Pearson correlation of 0.8908 for choroidal thickness and 0.9082 for choroidal area), while reducing the mean processing time per image from 34.49s ($\pm$15.09) to 1.25s ($\pm$0.10) on a standard laptop CPU and removing all manual interventions. DeepGPET will be made available for researchers upon publication.
Robust and efficient computation of retinal fractal dimension through deep approximation
Jul 12, 2022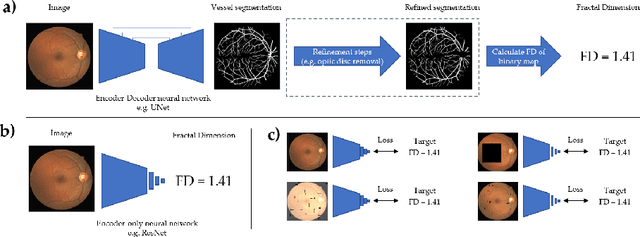


Abstract:A retinal trait, or phenotype, summarises a specific aspect of a retinal image in a single number. This can then be used for further analyses, e.g. with statistical methods. However, reducing an aspect of a complex image to a single, meaningful number is challenging. Thus, methods for calculating retinal traits tend to be complex, multi-step pipelines that can only be applied to high quality images. This means that researchers often have to discard substantial portions of the available data. We hypothesise that such pipelines can be approximated with a single, simpler step that can be made robust to common quality issues. We propose Deep Approximation of Retinal Traits (DART) where a deep neural network is used predict the output of an existing pipeline on high quality images from synthetically degraded versions of these images. We demonstrate DART on retinal Fractal Dimension (FD) calculated by VAMPIRE, using retinal images from UK Biobank that previous work identified as high quality. Our method shows very high agreement with FD VAMPIRE on unseen test images (Pearson r=0.9572). Even when those images are severely degraded, DART can still recover an FD estimate that shows good agreement with FD VAMPIRE obtained from the original images (Pearson r=0.8817). This suggests that our method could enable researchers to discard fewer images in the future. Our method can compute FD for over 1,000img/s using a single GPU. We consider these to be very encouraging initial results and hope to develop this approach into a useful tool for retinal analysis.
 Add to Chrome
 Add to Firefox
 Add to Edge