Niall Strang
OCTolyzer: Fully automatic analysis toolkit for segmentation and feature extracting in optical coherence tomography (OCT) and scanning laser ophthalmoscopy (SLO) data
Jul 19, 2024Abstract:Purpose: To describe OCTolyzer: an open-source toolkit for retinochoroidal analysis in optical coherence tomography (OCT) and scanning laser ophthalmoscopy (SLO) images. Method: OCTolyzer has two analysis suites, for SLO and OCT images. The former enables anatomical segmentation and feature measurement of the en face retinal vessels. The latter leverages image metadata for retinal layer segmentations and deep learning-based choroid layer segmentation to compute retinochoroidal measurements such as thickness and volume. We introduce OCTolyzer and assess the reproducibility of its OCT analysis suite for choroid analysis. Results: At the population-level, choroid region metrics were highly reproducible (Mean absolute error/Pearson/Spearman correlation for macular volume choroid thickness (CT):6.7$\mu$m/0.9933/0.9969, macular B-scan CT:11.6$\mu$m/0.9858/0.9889, peripapillary CT:5.0$\mu$m/0.9942/0.9940). Macular choroid vascular index (CVI) had good reproducibility (volume CVI:0.0271/0.9669/0.9655, B-scan CVI:0.0130/0.9090/0.9145). At the eye-level, measurement error in regional and vessel metrics were below 5% and 20% of the population's variability, respectively. Major outliers were from poor quality B-scans with thick choroids and invisible choroid-sclera boundary. Conclusions: OCTolyzer is the first open-source pipeline to convert OCT/SLO data into reproducible and clinically meaningful retinochoroidal measurements. OCT processing on a standard laptop CPU takes under 2 seconds for macular or peripapillary B-scans and 85 seconds for volume scans. OCTolyzer can help improve standardisation in the field of OCT/SLO image analysis and is freely available here: https://github.com/jaburke166/OCTolyzer.
Domain-specific augmentations with resolution agnostic self-attention mechanism improves choroid segmentation in optical coherence tomography images
May 23, 2024


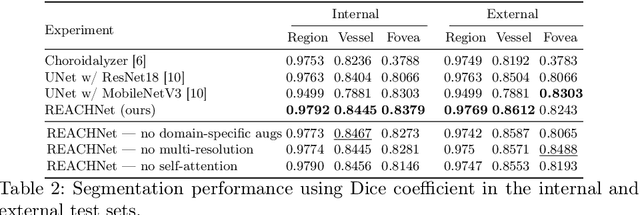
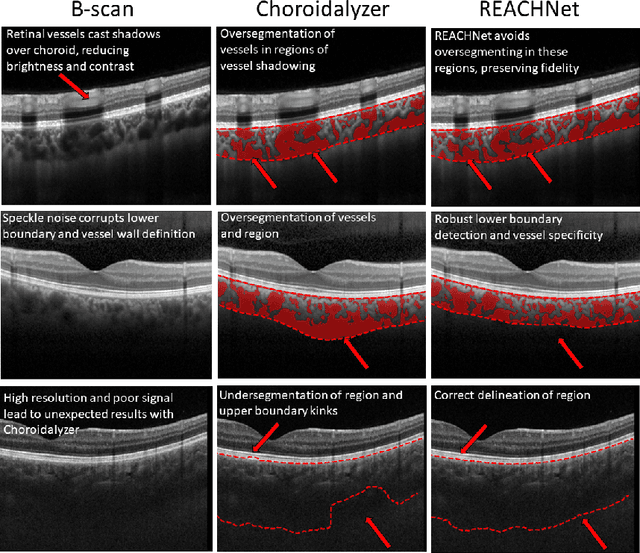
Abstract:The choroid is a key vascular layer of the eye, supplying oxygen to the retinal photoreceptors. Non-invasive enhanced depth imaging optical coherence tomography (EDI-OCT) has recently improved access and visualisation of the choroid, making it an exciting frontier for discovering novel vascular biomarkers in ophthalmology and wider systemic health. However, current methods to measure the choroid often require use of multiple, independent semi-automatic and deep learning-based algorithms which are not made open-source. Previously, Choroidalyzer -- an open-source, fully automatic deep learning method trained on 5,600 OCT B-scans from 385 eyes -- was developed to fully segment and quantify the choroid in EDI-OCT images, thus addressing these issues. Using the same dataset, we propose a Robust, Resolution-agnostic and Efficient Attention-based network for CHoroid segmentation (REACH). REACHNet leverages multi-resolution training with domain-specific data augmentation to promote generalisation, and uses a lightweight architecture with resolution-agnostic self-attention which is not only faster than Choroidalyzer's previous network (4 images/s vs. 2.75 images/s on a standard laptop CPU), but has greater performance for segmenting the choroid region, vessels and fovea (Dice coefficient for region 0.9769 vs. 0.9749, vessels 0.8612 vs. 0.8192 and fovea 0.8243 vs. 0.3783) due to its improved hyperparameter configuration and model training pipeline. REACHNet can be used with Choroidalyzer as a drop-in replacement for the original model and will be made available upon publication.
Applicability of oculomics for individual risk prediction: Repeatability and robustness of retinal Fractal Dimension using DART and AutoMorph
Mar 11, 2024Abstract:Purpose: To investigate whether Fractal Dimension (FD)-based oculomics could be used for individual risk prediction by evaluating repeatability and robustness. Methods: We used two datasets: Caledonia, healthy adults imaged multiple times in quick succession for research (26 subjects, 39 eyes, 377 colour fundus images), and GRAPE, glaucoma patients with baseline and follow-up visits (106 subjects, 196 eyes, 392 images). Mean follow-up time was 18.3 months in GRAPE, thus it provides a pessimistic lower-bound as vasculature could change. FD was computed with DART and AutoMorph. Image quality was assessed with QuickQual, but no images were initially excluded. Pearson, Spearman, and Intraclass Correlation (ICC) were used for population-level repeatability. For individual-level repeatability, we introduce measurement noise parameter {\lambda} which is within-eye Standard Deviation (SD) of FD measurements in units of between-eyes SD. Results: In Caledonia, ICC was 0.8153 for DART and 0.5779 for AutoMorph, Pearson/Spearman correlation (first and last image) 0.7857/0.7824 for DART, and 0.3933/0.6253 for AutoMorph. In GRAPE, Pearson/Spearman correlation (first and next visit) was 0.7479/0.7474 for DART, and 0.7109/0.7208 for AutoMorph (all p<0.0001). Median {\lambda} in Caledonia without exclusions was 3.55\% for DART and 12.65\% for AutoMorph, and improved to up to 1.67\% and 6.64\% with quality-based exclusions, respectively. Quality exclusions primarily mitigated large outliers. Worst quality in an eye correlated strongly with {\lambda} (Pearson 0.5350-0.7550, depending on dataset and method, all p<0.0001). Conclusions: Repeatability was sufficient for individual-level predictions in heterogeneous populations. DART performed better on all metrics and might be able to detect small, longitudinal changes, highlighting the potential of robust methods.
Choroidalyzer: An open-source, end-to-end pipeline for choroidal analysis in optical coherence tomography
Dec 05, 2023


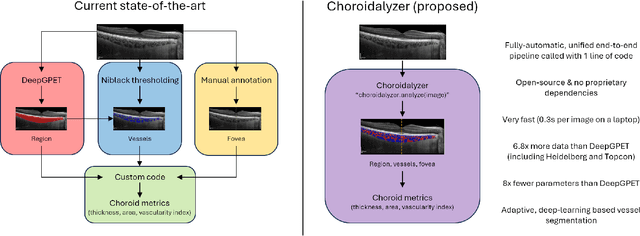
Abstract:Purpose: To develop Choroidalyzer, an open-source, end-to-end pipeline for segmenting the choroid region, vessels, and fovea, and deriving choroidal thickness, area, and vascular index. Methods: We used 5,600 OCT B-scans (233 subjects, 6 systemic disease cohorts, 3 device types, 2 manufacturers). To generate region and vessel ground-truths, we used state-of-the-art automatic methods following manual correction of inaccurate segmentations, with foveal positions manually annotated. We trained a U-Net deep-learning model to detect the region, vessels, and fovea to calculate choroid thickness, area, and vascular index in a fovea-centred region of interest. We analysed segmentation agreement (AUC, Dice) and choroid metrics agreement (Pearson, Spearman, mean absolute error (MAE)) in internal and external test sets. We compared Choroidalyzer to two manual graders on a small subset of external test images and examined cases of high error. Results: Choroidalyzer took 0.299 seconds per image on a standard laptop and achieved excellent region (Dice: internal 0.9789, external 0.9749), very good vessel segmentation performance (Dice: internal 0.8817, external 0.8703) and excellent fovea location prediction (MAE: internal 3.9 pixels, external 3.4 pixels). For thickness, area, and vascular index, Pearson correlations were 0.9754, 0.9815, and 0.8285 (internal) / 0.9831, 0.9779, 0.7948 (external), respectively (all p<0.0001). Choroidalyzer's agreement with graders was comparable to the inter-grader agreement across all metrics. Conclusions: Choroidalyzer is an open-source, end-to-end pipeline that accurately segments the choroid and reliably extracts thickness, area, and vascular index. Especially choroidal vessel segmentation is a difficult and subjective task, and fully-automatic methods like Choroidalyzer could provide objectivity and standardisation.
 Add to Chrome
 Add to Firefox
 Add to Edge