Koushik Nagasubramanian
Iowa State University
Usefulness of interpretability methods to explain deep learning based plant stress phenotyping
Jul 11, 2020


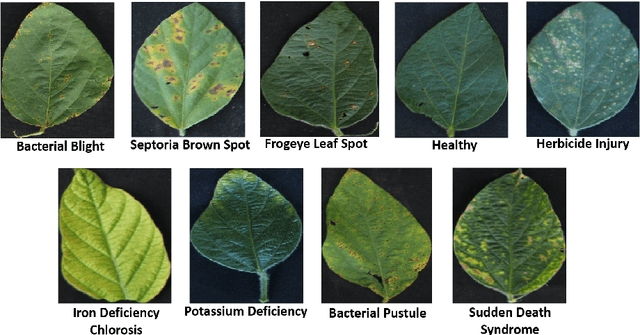
Abstract:Deep learning techniques have been successfully deployed for automating plant stress identification and quantification. In recent years, there is a growing push towards training models that are interpretable -i.e. that justify their classification decisions by visually highlighting image features that were crucial for classification decisions. The expectation is that trained network models utilize image features that mimic visual cues used by plant pathologists. In this work, we compare some of the most popular interpretability methods: Saliency Maps, SmoothGrad, Guided Backpropogation, Deep Taylor Decomposition, Integrated Gradients, Layer-wise Relevance Propagation and Gradient times Input, for interpreting the deep learning model. We train a DenseNet-121 network for the classification of eight different soybean stresses (biotic and abiotic). Using a dataset consisting of 16,573 RGB images of healthy and stressed soybean leaflets captured under controlled conditions, we obtained an overall classification accuracy of 95.05 \%. For a diverse subset of the test data, we compared the important features with those identified by a human expert. We observed that most interpretability methods identify the infected regions of the leaf as important features for some -- but not all -- of the correctly classified images. For some images, the output of the interpretability methods indicated that spurious feature correlations may have been used to correctly classify them. Although the output explanation maps of these interpretability methods may be different from each other for a given image, we advocate the use of these interpretability methods as `hypothesis generation' mechanisms that can drive scientific insight.
How useful is Active Learning for Image-based Plant Phenotyping?
Jul 01, 2020


Abstract:Deep learning models have been successfully deployed for a diverse array of image-based plant phenotyping applications including disease detection and classification. However, successful deployment of supervised deep learning models requires large amount of labeled data, which is a significant challenge in plant science (and most biological) domains due to the inherent complexity. Specifically, data annotation is costly, laborious, time consuming and needs domain expertise for phenotyping tasks, especially for diseases. To overcome this challenge, active learning algorithms have been proposed that reduce the amount of labeling needed by deep learning models to achieve good predictive performance. Active learning methods adaptively select samples to annotate using an acquisition function to achieve maximum (classification) performance under a fixed labeling budget. We report the performance of four different active learning methods, (1) Deep Bayesian Active Learning (DBAL), (2) Entropy, (3) Least Confidence, and (4) Coreset, with conventional random sampling-based annotation for two different image-based classification datasets. The first image dataset consists of soybean [Glycine max L. (Merr.)] leaves belonging to eight different soybean stresses and a healthy class, and the second consists of nine different weed species from the field. For a fixed labeling budget, we observed that the classification performance of deep learning models with active learning-based acquisition strategies is better than random sampling-based acquisition for both datasets. The integration of active learning strategies for data annotation can help mitigate labelling challenges in the plant sciences applications particularly where deep domain knowledge is required.
Explaining hyperspectral imaging based plant disease identification: 3D CNN and saliency maps
Apr 24, 2018


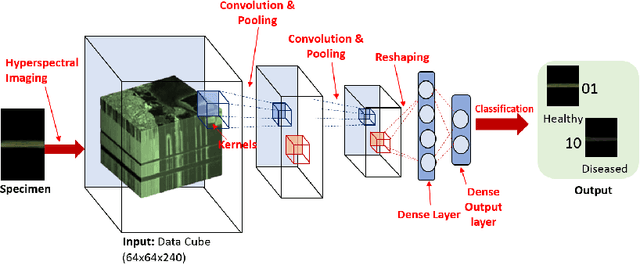
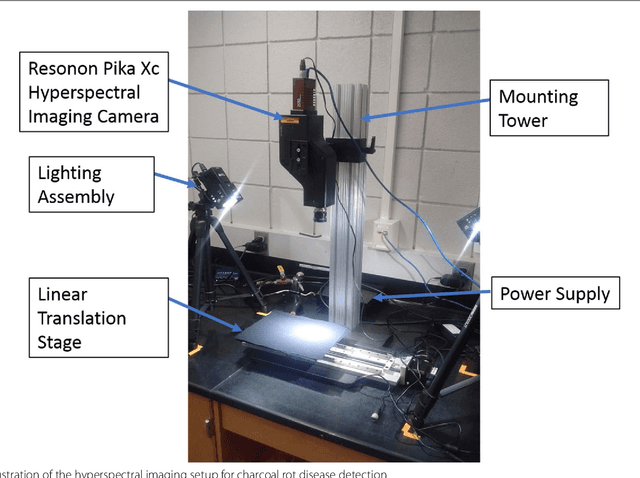
Abstract:Our overarching goal is to develop an accurate and explainable model for plant disease identification using hyperspectral data. Charcoal rot is a soil borne fungal disease that affects the yield of soybean crops worldwide. Hyperspectral images were captured at 240 different wavelengths in the range of 383 - 1032 nm. We developed a 3D Convolutional Neural Network model for soybean charcoal rot disease identification. Our model has classification accuracy of 95.73\% and an infected class F1 score of 0.87. We infer the trained model using saliency map and visualize the most sensitive pixel locations that enable classification. The sensitivity of individual wavelengths for classification was also determined using the saliency map visualization. We identify the most sensitive wavelength as 733 nm using the saliency map visualization. Since the most sensitive wavelength is in the Near Infrared Region(700 - 1000 nm) of the electromagnetic spectrum, which is also the commonly used spectrum region for determining the vegetation health of the plant, we were more confident in the predictions using our model.
Hyperspectral band selection using genetic algorithm and support vector machines for early identification of charcoal rot disease in soybean
Oct 12, 2017


Abstract:Charcoal rot is a fungal disease that thrives in warm dry conditions and affects the yield of soybeans and other important agronomic crops worldwide. There is a need for robust, automatic and consistent early detection and quantification of disease symptoms which are important in breeding programs for the development of improved cultivars and in crop production for the implementation of disease control measures for yield protection. Current methods of plant disease phenotyping are predominantly visual and hence are slow and prone to human error and variation. There has been increasing interest in hyperspectral imaging applications for early detection of disease symptoms. However, the high dimensionality of hyperspectral data makes it very important to have an efficient analysis pipeline in place for the identification of disease so that effective crop management decisions can be made. The focus of this work is to determine the minimal number of most effective hyperspectral bands that can distinguish between healthy and diseased specimens early in the growing season. Healthy and diseased hyperspectral data cubes were captured at 3, 6, 9, 12, and 15 days after inoculation. We utilized inoculated and control specimens from 4 different genotypes. Each hyperspectral image was captured at 240 different wavelengths in the range of 383 to 1032 nm. We used a combination of genetic algorithm as an optimizer and support vector machines as a classifier for identification of maximally effective band combinations. A binary classification between healthy and infected samples using six selected band combinations obtained a classification accuracy of 97% and a F1 score of 0.97 for the infected class. The results demonstrated that these carefully chosen bands are more informative than RGB images, and could be used in a multispectral camera for remote identification of charcoal rot infection in soybean.
 Add to Chrome
 Add to Firefox
 Add to Edge