Harrison X. Bai
Abn-BLIP: Abnormality-aligned Bootstrapping Language-Image Pre-training for Pulmonary Embolism Diagnosis and Report Generation from CTPA
Mar 03, 2025Abstract:Medical imaging plays a pivotal role in modern healthcare, with computed tomography pulmonary angiography (CTPA) being a critical tool for diagnosing pulmonary embolism and other thoracic conditions. However, the complexity of interpreting CTPA scans and generating accurate radiology reports remains a significant challenge. This paper introduces Abn-BLIP (Abnormality-aligned Bootstrapping Language-Image Pretraining), an advanced diagnosis model designed to align abnormal findings to generate the accuracy and comprehensiveness of radiology reports. By leveraging learnable queries and cross-modal attention mechanisms, our model demonstrates superior performance in detecting abnormalities, reducing missed findings, and generating structured reports compared to existing methods. Our experiments show that Abn-BLIP outperforms state-of-the-art medical vision-language models and 3D report generation methods in both accuracy and clinical relevance. These results highlight the potential of integrating multimodal learning strategies for improving radiology reporting. The source code is available at https://github.com/zzs95/abn-blip.
Optimizing Prompt Strategies for SAM: Advancing lesion Segmentation Across Diverse Medical Imaging Modalities
Dec 28, 2024


Abstract:Purpose: To evaluate various Segmental Anything Model (SAM) prompt strategies across four lesions datasets and to subsequently develop a reinforcement learning (RL) agent to optimize SAM prompt placement. Materials and Methods: This retrospective study included patients with four independent ovarian, lung, renal, and breast tumor datasets. Manual segmentation and SAM-assisted segmentation were performed for all lesions. A RL model was developed to predict and select SAM points to maximize segmentation performance. Statistical analysis of segmentation was conducted using pairwise t-tests. Results: Results show that increasing the number of prompt points significantly improves segmentation accuracy, with Dice coefficients rising from 0.272 for a single point to 0.806 for five or more points in ovarian tumors. The prompt location also influenced performance, with surface and union-based prompts outperforming center-based prompts, achieving mean Dice coefficients of 0.604 and 0.724 for ovarian and breast tumors, respectively. The RL agent achieved a peak Dice coefficient of 0.595 for ovarian tumors, outperforming random and alternative RL strategies. Additionally, it significantly reduced segmentation time, achieving a nearly 10-fold improvement compared to manual methods using SAM. Conclusion: While increased SAM prompts and non-centered prompts generally improved segmentation accuracy, each pathology and modality has specific optimal thresholds and placement strategies. Our RL agent achieved superior performance compared to other agents while achieving a significant reduction in segmentation time.
Optimizing prompt strategies for the Segment Anything Model are explored, focusing on prompt location, number, and reinforcement learning-based agent for prompt placement across four lesion datasets
Dec 23, 2024


Abstract:Purpose: To evaluate various Segmental Anything Model (SAM) prompt strategies across four lesions datasets and to subsequently develop a reinforcement learning (RL) agent to optimize SAM prompt placement. Materials and Methods: This retrospective study included patients with four independent ovarian, lung, renal, and breast tumor datasets. Manual segmentation and SAM-assisted segmentation were performed for all lesions. A RL model was developed to predict and select SAM points to maximize segmentation performance. Statistical analysis of segmentation was conducted using pairwise t-tests. Results: Results show that increasing the number of prompt points significantly improves segmentation accuracy, with Dice coefficients rising from 0.272 for a single point to 0.806 for five or more points in ovarian tumors. The prompt location also influenced performance, with surface and union-based prompts outperforming center-based prompts, achieving mean Dice coefficients of 0.604 and 0.724 for ovarian and breast tumors, respectively. The RL agent achieved a peak Dice coefficient of 0.595 for ovarian tumors, outperforming random and alternative RL strategies. Additionally, it significantly reduced segmentation time, achieving a nearly 10-fold improvement compared to manual methods using SAM. Conclusion: While increased SAM prompts and non-centered prompts generally improved segmentation accuracy, each pathology and modality has specific optimal thresholds and placement strategies. Our RL agent achieved superior performance compared to other agents while achieving a significant reduction in segmentation time.
Unraveling Radiomics Complexity: Strategies for Optimal Simplicity in Predictive Modeling
Jul 05, 2024


Abstract:Background: The high dimensionality of radiomic feature sets, the variability in radiomic feature types and potentially high computational requirements all underscore the need for an effective method to identify the smallest set of predictive features for a given clinical problem. Purpose: Develop a methodology and tools to identify and explain the smallest set of predictive radiomic features. Materials and Methods: 89,714 radiomic features were extracted from five cancer datasets: low-grade glioma, meningioma, non-small cell lung cancer (NSCLC), and two renal cell carcinoma cohorts (n=2104). Features were categorized by computational complexity into morphological, intensity, texture, linear filters, and nonlinear filters. Models were trained and evaluated on each complexity level using the area under the curve (AUC). The most informative features were identified, and their importance was explained. The optimal complexity level and associated most informative features were identified using systematic statistical significance analyses and a false discovery avoidance procedure, respectively. Their predictive importance was explained using a novel tree-based method. Results: MEDimage, a new open-source tool, was developed to facilitate radiomic studies. Morphological features were optimal for MRI-based meningioma (AUC: 0.65) and low-grade glioma (AUC: 0.68). Intensity features were optimal for CECT-based renal cell carcinoma (AUC: 0.82) and CT-based NSCLC (AUC: 0.76). Texture features were optimal for MRI-based renal cell carcinoma (AUC: 0.72). Tuning the Hounsfield unit range improved results for CECT-based renal cell carcinoma (AUC: 0.86). Conclusion: Our proposed methodology and software can estimate the optimal radiomics complexity level for specific medical outcomes, potentially simplifying the use of radiomics in predictive modeling across various contexts.
Pulmonary Embolism Mortality Prediction Using Multimodal Learning Based on Computed Tomography Angiography and Clinical Data
Jun 03, 2024Abstract:Purpose: Pulmonary embolism (PE) is a significant cause of mortality in the United States. The objective of this study is to implement deep learning (DL) models using Computed Tomography Pulmonary Angiography (CTPA), clinical data, and PE Severity Index (PESI) scores to predict PE mortality. Materials and Methods: 918 patients (median age 64 years, range 13-99 years, 52% female) with 3,978 CTPAs were identified via retrospective review across three institutions. To predict survival, an AI model was used to extract disease-related imaging features from CTPAs. Imaging features and/or clinical variables were then incorporated into DL models to predict survival outcomes. Four models were developed as follows: (1) using CTPA imaging features only; (2) using clinical variables only; (3) multimodal, integrating both CTPA and clinical variables; and (4) multimodal fused with calculated PESI score. Performance and contribution from each modality were evaluated using concordance index (c-index) and Net Reclassification Improvement, respectively. Performance was compared to PESI predictions using the Wilcoxon signed-rank test. Kaplan-Meier analysis was performed to stratify patients into high- and low-risk groups. Additional factor-risk analysis was conducted to account for right ventricular (RV) dysfunction. Results: For both data sets, the PESI-fused and multimodal models achieved higher c-indices than PESI alone. Following stratification of patients into high- and low-risk groups by multimodal and PESI-fused models, mortality outcomes differed significantly (both p<0.001). A strong correlation was found between high-risk grouping and RV dysfunction. Conclusions: Multiomic DL models incorporating CTPA features, clinical data, and PESI achieved higher c-indices than PESI alone for PE survival prediction.
Evidential Uncertainty Quantification: A Variance-Based Perspective
Nov 19, 2023


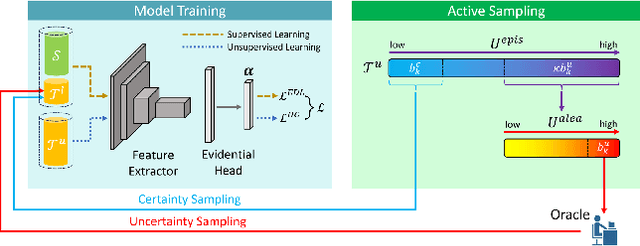
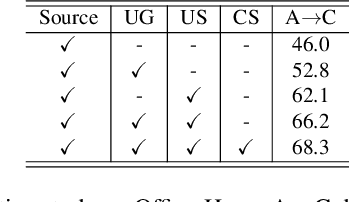
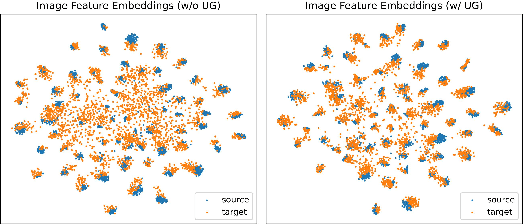
Abstract:Uncertainty quantification of deep neural networks has become an active field of research and plays a crucial role in various downstream tasks such as active learning. Recent advances in evidential deep learning shed light on the direct quantification of aleatoric and epistemic uncertainties with a single forward pass of the model. Most traditional approaches adopt an entropy-based method to derive evidential uncertainty in classification, quantifying uncertainty at the sample level. However, the variance-based method that has been widely applied in regression problems is seldom used in the classification setting. In this work, we adapt the variance-based approach from regression to classification, quantifying classification uncertainty at the class level. The variance decomposition technique in regression is extended to class covariance decomposition in classification based on the law of total covariance, and the class correlation is also derived from the covariance. Experiments on cross-domain datasets are conducted to illustrate that the variance-based approach not only results in similar accuracy as the entropy-based one in active domain adaptation but also brings information about class-wise uncertainties as well as between-class correlations. The code is available at https://github.com/KerryDRX/EvidentialADA. This alternative means of evidential uncertainty quantification will give researchers more options when class uncertainties and correlations are important in their applications.
 Add to Chrome
 Add to Firefox
 Add to Edge