Elsa Cazelles
PCA of probability measures: Sparse and Dense sampling regimes
Feb 02, 2026Abstract:A common approach to perform PCA on probability measures is to embed them into a Hilbert space where standard functional PCA techniques apply. While convergence rates for estimating the embedding of a single measure from $m$ samples are well understood, the literature has not addressed the setting involving multiple measures. In this paper, we study PCA in a double asymptotic regime where $n$ probability measures are observed, each through $m$ samples. We derive convergence rates of the form $n^{-1/2} + m^{-α}$ for the empirical covariance operator and the PCA excess risk, where $α>0$ depends on the chosen embedding. This characterizes the relationship between the number $n$ of measures and the number $m$ of samples per measure, revealing a sparse (small $m$) to dense (large $m$) transition in the convergence behavior. Moreover, we prove that the dense-regime rate is minimax optimal for the empirical covariance error. Our numerical experiments validate these theoretical rates and demonstrate that appropriate subsampling preserves PCA accuracy while reducing computational cost.
Efficient Gaussian process learning via subspace projections
Jan 26, 2026Abstract:We propose a novel training objective for GPs constructed using lower-dimensional linear projections of the data, referred to as \emph{projected likelihood} (PL). We provide a closed-form expression for the information loss related to the PL and empirically show that it can be reduced with random projections on the unit sphere. We show the superiority of the PL, in terms of accuracy and computational efficiency, over the exact GP training and the variational free energy approach to sparse GPs over different optimisers, kernels and datasets of moderately large sizes.
Busemann Functions in the Wasserstein Space: Existence, Closed-Forms, and Applications to Slicing
Oct 06, 2025Abstract:The Busemann function has recently found much interest in a variety of geometric machine learning problems, as it naturally defines projections onto geodesic rays of Riemannian manifolds and generalizes the notion of hyperplanes. As several sources of data can be conveniently modeled as probability distributions, it is natural to study this function in the Wasserstein space, which carries a rich formal Riemannian structure induced by Optimal Transport metrics. In this work, we investigate the existence and computation of Busemann functions in Wasserstein space, which admits geodesic rays. We establish closed-form expressions in two important cases: one-dimensional distributions and Gaussian measures. These results enable explicit projection schemes for probability distributions on $\mathbb{R}$, which in turn allow us to define novel Sliced-Wasserstein distances over Gaussian mixtures and labeled datasets. We demonstrate the efficiency of those original schemes on synthetic datasets as well as transfer learning problems.
On the Wasserstein Geodesic Principal Component Analysis of probability measures
Jun 04, 2025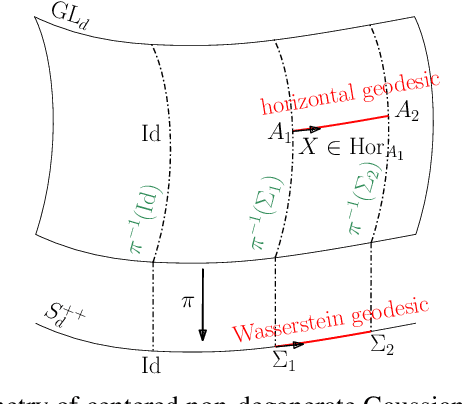
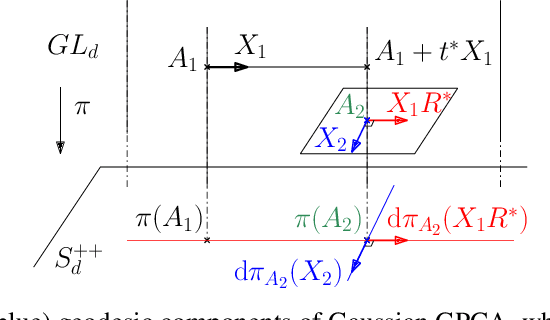
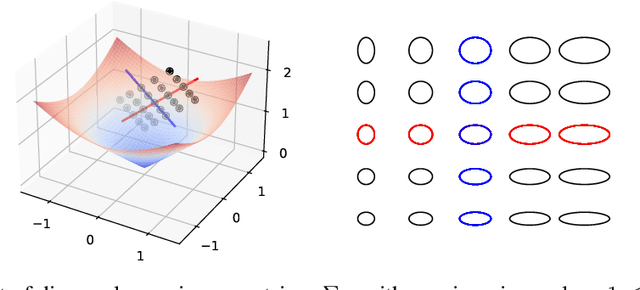
Abstract:This paper focuses on Geodesic Principal Component Analysis (GPCA) on a collection of probability distributions using the Otto-Wasserstein geometry. The goal is to identify geodesic curves in the space of probability measures that best capture the modes of variation of the underlying dataset. We first address the case of a collection of Gaussian distributions, and show how to lift the computations in the space of invertible linear maps. For the more general setting of absolutely continuous probability measures, we leverage a novel approach to parameterizing geodesics in Wasserstein space with neural networks. Finally, we compare to classical tangent PCA through various examples and provide illustrations on real-world datasets.
Audio signal interpolation using optimal transportation of spectrograms
Feb 21, 2025Abstract:We present a novel approach for generating an artificial audio signal that interpolates between given source and target sounds. Our approach relies on the computation of Wasserstein barycenters of the source and target spectrograms, followed by phase reconstruction and inversion. In contrast with previous works, our new method considers the spectrograms globally and does not operate on a temporal frame-to-frame basis. An other contribution is to endow the transportation cost matrix with a specific structure that prohibits remote displacements of energy along the time axis, and for which optimal transport is made possible by leveraging the unbalanced transport framework. The proposed cost matrix makes sense from the audio perspective and also allows to reduce the computation load. Results with synthetic musical notes and real environmental sounds illustrate the potential of our novel approach.
Scalable and consistent embedding of probability measures into Hilbert spaces via measure quantization
Feb 07, 2025


Abstract:This paper is focused on statistical learning from data that come as probability measures. In this setting, popular approaches consist in embedding such data into a Hilbert space with either Linearized Optimal Transport or Kernel Mean Embedding. However, the cost of computing such embeddings prohibits their direct use in large-scale settings. We study two methods based on measure quantization for approximating input probability measures with discrete measures of small-support size. The first one is based on optimal quantization of each input measure, while the second one relies on mean-measure quantization. We study the consistency of such approximations, and its implication for scalable embeddings of probability measures into a Hilbert space at a low computational cost. We finally illustrate our findings with various numerical experiments.
Low dimensional representation of multi-patient flow cytometry datasets using optimal transport for minimal residual disease detection in leukemia
Jul 24, 2024Abstract:Representing and quantifying Minimal Residual Disease (MRD) in Acute Myeloid Leukemia (AML), a type of cancer that affects the blood and bone marrow, is essential in the prognosis and follow-up of AML patients. As traditional cytological analysis cannot detect leukemia cells below 5\%, the analysis of flow cytometry dataset is expected to provide more reliable results. In this paper, we explore statistical learning methods based on optimal transport (OT) to achieve a relevant low-dimensional representation of multi-patient flow cytometry measurements (FCM) datasets considered as high-dimensional probability distributions. Using the framework of OT, we justify the use of the K-means algorithm for dimensionality reduction of multiple large-scale point clouds through mean measure quantization by merging all the data into a single point cloud. After this quantization step, the visualization of the intra and inter-patients FCM variability is carried out by embedding low-dimensional quantized probability measures into a linear space using either Wasserstein Principal Component Analysis (PCA) through linearized OT or log-ratio PCA of compositional data. Using a publicly available FCM dataset and a FCM dataset from Bordeaux University Hospital, we demonstrate the benefits of our approach over the popular kernel mean embedding technique for statistical learning from multiple high-dimensional probability distributions. We also highlight the usefulness of our methodology for low-dimensional projection and clustering patient measurements according to their level of MRD in AML from FCM. In particular, our OT-based approach allows a relevant and informative two-dimensional representation of the results of the FlowSom algorithm, a state-of-the-art method for the detection of MRD in AML using multi-patient FCM.
Computationally-efficient initialisation of GPs: The generalised variogram method
Oct 11, 2022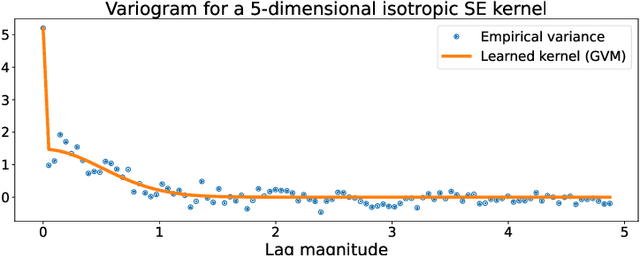

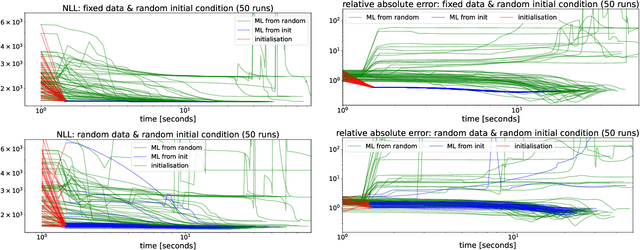

Abstract:We present a computationally-efficient strategy to find the hyperparameters of a Gaussian process (GP) avoiding the computation of the likelihood function. The found hyperparameters can then be used directly for regression or passed as initial conditions to maximum-likelihood (ML) training. Motivated by the fact that training a GP via ML is equivalent (on average) to minimising the KL-divergence between the true and learnt model, we set to explore different metrics/divergences among GPs that are computationally inexpensive and provide estimates close to those of ML. In particular, we identify the GP hyperparameters by matching the empirical covariance to a parametric candidate, proposing and studying various measures of discrepancy. Our proposal extends the Variogram method developed by the geostatistics literature and thus is referred to as the Generalised Variogram method (GVM). In addition to the theoretical presentation of GVM, we provide experimental validation in terms of accuracy, consistency with ML and computational complexity for different kernels using synthetic and real-world data.
Streaming computation of optimal weak transport barycenters
Feb 26, 2021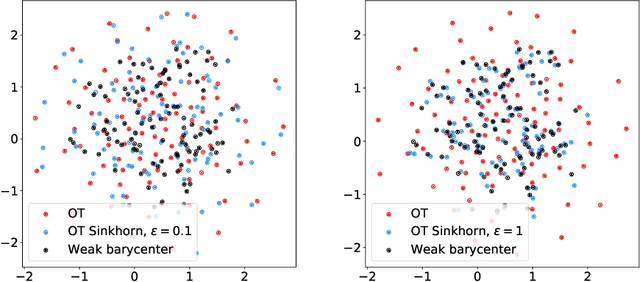
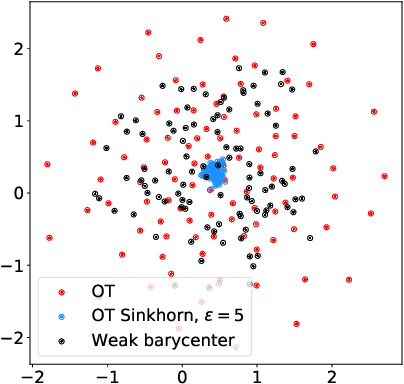
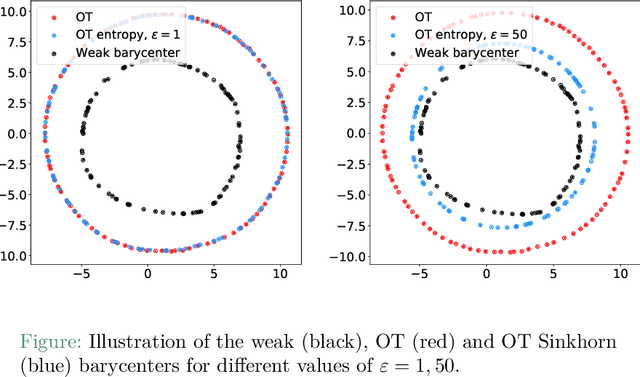
Abstract:We introduce the weak barycenter of a family of probability distributions, based on the recently developed notion of optimal weak transport of measures arXiv:1412.7480(v4). We provide a theoretical analysis of the weak barycenter and its relationship to the classic Wasserstein barycenter, and discuss its meaning in the light of convex ordering between probability measures. In particular, we argue that, rather than averaging the information of the input distributions as done by the usual optimal transport barycenters, weak barycenters contain geometric information shared across all input distributions, which can be interpreted as a latent random variable affecting all the measures. We also provide iterative algorithms to compute a weak barycenter for either finite or infinite families of arbitrary measures (with finite moments of order 2), which are particularly well suited for the streaming setting, i.e., when measures arrive sequentially. In particular, our streaming computation of weak barycenters does not require to smooth empirical measures or to define a common grid for them, as some of the previous approaches to Wasserstin barycenters do. The concept of weak barycenter and our computation approaches are illustrated on synthetic examples, validated on 2D real-world data and compared to the classical Wasserstein barycenters.
The Wasserstein-Fourier Distance for Stationary Time Series
Dec 11, 2019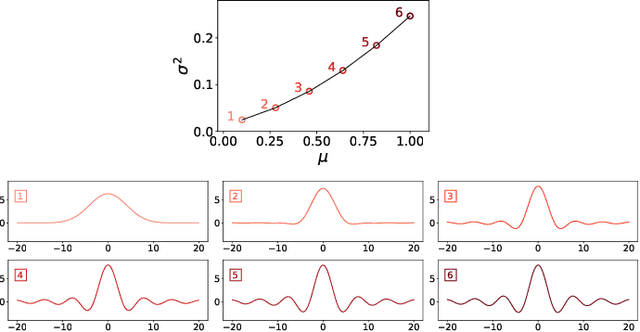

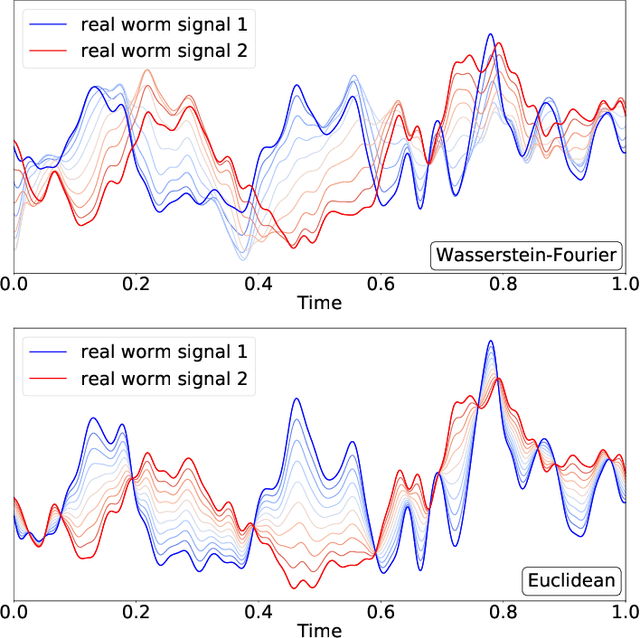
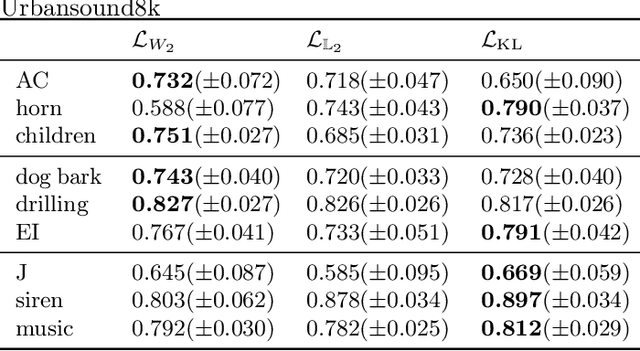
Abstract:We introduce a novel framework for analysing stationary time series based on optimal transport distances and spectral embeddings. First, we represent time series by their power spectral density (PSD), which summarises the signal energy spread across the Fourier spectrum. Second, we endow the space of PSDs with the Wasserstein distance, which capitalises its unique ability to preserve the geometric information of a set of distributions. These two steps enable us to define the Wasserstein-Fourier (WF) distance, which allows us to compare stationary time series even when they differ in sampling rate, length, magnitude and phase. We analyse the features of WF by blending the properties of the Wasserstein distance and those of the Fourier transform. The proposed WF distance is then used in three sets of key time series applications considering real-world datasets: (i) interpolation of time series leading to data augmentation, (ii) dimensionality reduction via non-linear PCA, and (iii) parametric and non-parametric classification tasks. Our conceptual and experimental findings validate the general concept of using divergences of distributions, especially the Wasserstein distance, to analyse time series through comparing their spectral representations.
 Add to Chrome
 Add to Firefox
 Add to Edge