Jérémie Bigot
Institut de Mathématiques de Bordeaux, Université de Bordeaux
PCA of probability measures: Sparse and Dense sampling regimes
Feb 02, 2026Abstract:A common approach to perform PCA on probability measures is to embed them into a Hilbert space where standard functional PCA techniques apply. While convergence rates for estimating the embedding of a single measure from $m$ samples are well understood, the literature has not addressed the setting involving multiple measures. In this paper, we study PCA in a double asymptotic regime where $n$ probability measures are observed, each through $m$ samples. We derive convergence rates of the form $n^{-1/2} + m^{-α}$ for the empirical covariance operator and the PCA excess risk, where $α>0$ depends on the chosen embedding. This characterizes the relationship between the number $n$ of measures and the number $m$ of samples per measure, revealing a sparse (small $m$) to dense (large $m$) transition in the convergence behavior. Moreover, we prove that the dense-regime rate is minimax optimal for the empirical covariance error. Our numerical experiments validate these theoretical rates and demonstrate that appropriate subsampling preserves PCA accuracy while reducing computational cost.
Stochastic Adaptive Gradient Descent Without Descent
Sep 18, 2025Abstract:We introduce a new adaptive step-size strategy for convex optimization with stochastic gradient that exploits the local geometry of the objective function only by means of a first-order stochastic oracle and without any hyper-parameter tuning. The method comes from a theoretically-grounded adaptation of the Adaptive Gradient Descent Without Descent method to the stochastic setting. We prove the convergence of stochastic gradient descent with our step-size under various assumptions, and we show that it empirically competes against tuned baselines.
Scalable and consistent embedding of probability measures into Hilbert spaces via measure quantization
Feb 07, 2025


Abstract:This paper is focused on statistical learning from data that come as probability measures. In this setting, popular approaches consist in embedding such data into a Hilbert space with either Linearized Optimal Transport or Kernel Mean Embedding. However, the cost of computing such embeddings prohibits their direct use in large-scale settings. We study two methods based on measure quantization for approximating input probability measures with discrete measures of small-support size. The first one is based on optimal quantization of each input measure, while the second one relies on mean-measure quantization. We study the consistency of such approximations, and its implication for scalable embeddings of probability measures into a Hilbert space at a low computational cost. We finally illustrate our findings with various numerical experiments.
Low dimensional representation of multi-patient flow cytometry datasets using optimal transport for minimal residual disease detection in leukemia
Jul 24, 2024Abstract:Representing and quantifying Minimal Residual Disease (MRD) in Acute Myeloid Leukemia (AML), a type of cancer that affects the blood and bone marrow, is essential in the prognosis and follow-up of AML patients. As traditional cytological analysis cannot detect leukemia cells below 5\%, the analysis of flow cytometry dataset is expected to provide more reliable results. In this paper, we explore statistical learning methods based on optimal transport (OT) to achieve a relevant low-dimensional representation of multi-patient flow cytometry measurements (FCM) datasets considered as high-dimensional probability distributions. Using the framework of OT, we justify the use of the K-means algorithm for dimensionality reduction of multiple large-scale point clouds through mean measure quantization by merging all the data into a single point cloud. After this quantization step, the visualization of the intra and inter-patients FCM variability is carried out by embedding low-dimensional quantized probability measures into a linear space using either Wasserstein Principal Component Analysis (PCA) through linearized OT or log-ratio PCA of compositional data. Using a publicly available FCM dataset and a FCM dataset from Bordeaux University Hospital, we demonstrate the benefits of our approach over the popular kernel mean embedding technique for statistical learning from multiple high-dimensional probability distributions. We also highlight the usefulness of our methodology for low-dimensional projection and clustering patient measurements according to their level of MRD in AML from FCM. In particular, our OT-based approach allows a relevant and informative two-dimensional representation of the results of the FlowSom algorithm, a state-of-the-art method for the detection of MRD in AML using multi-patient FCM.
High-dimensional analysis of ridge regression for non-identically distributed data with a variance profile
Mar 29, 2024Abstract:High-dimensional linear regression has been thoroughly studied in the context of independent and identically distributed data. We propose to investigate high-dimensional regression models for independent but non-identically distributed data. To this end, we suppose that the set of observed predictors (or features) is a random matrix with a variance profile and with dimensions growing at a proportional rate. Assuming a random effect model, we study the predictive risk of the ridge estimator for linear regression with such a variance profile. In this setting, we provide deterministic equivalents of this risk and of the degree of freedom of the ridge estimator. For certain class of variance profile, our work highlights the emergence of the well-known double descent phenomenon in high-dimensional regression for the minimum norm least-squares estimator when the ridge regularization parameter goes to zero. We also exhibit variance profiles for which the shape of this predictive risk differs from double descent. The proofs of our results are based on tools from random matrix theory in the presence of a variance profile that have not been considered so far to study regression models. Numerical experiments are provided to show the accuracy of the aforementioned deterministic equivalents on the computation of the predictive risk of ridge regression. We also investigate the similarities and differences that exist with the standard setting of independent and identically distributed data.
Stochastic optimal transport in Banach Spaces for regularized estimation of multivariate quantiles
Feb 02, 2023Abstract:We introduce a new stochastic algorithm for solving entropic optimal transport (EOT) between two absolutely continuous probability measures $\mu$ and $\nu$. Our work is motivated by the specific setting of Monge-Kantorovich quantiles where the source measure $\mu$ is either the uniform distribution on the unit hypercube or the spherical uniform distribution. Using the knowledge of the source measure, we propose to parametrize a Kantorovich dual potential by its Fourier coefficients. In this way, each iteration of our stochastic algorithm reduces to two Fourier transforms that enables us to make use of the Fast Fourier Transform (FFT) in order to implement a fast numerical method to solve EOT. We study the almost sure convergence of our stochastic algorithm that takes its values in an infinite-dimensional Banach space. Then, using numerical experiments, we illustrate the performances of our approach on the computation of regularized Monge-Kantorovich quantiles. In particular, we investigate the potential benefits of entropic regularization for the smooth estimation of multivariate quantiles using data sampled from the target measure $\nu$.
On the potential benefits of entropic regularization for smoothing Wasserstein estimators
Oct 13, 2022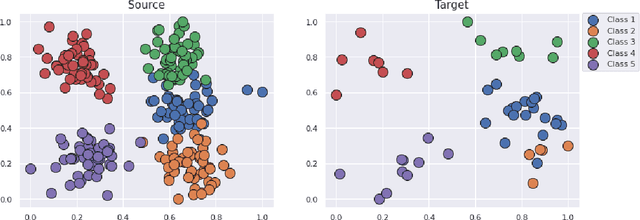

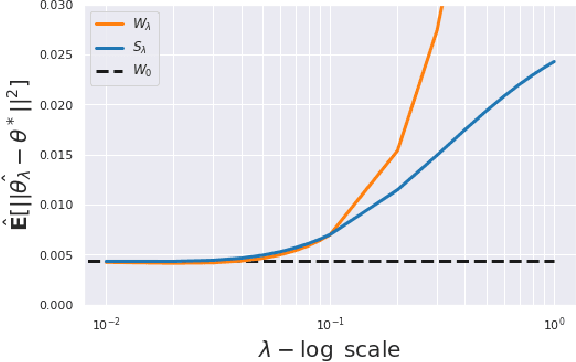

Abstract:This paper is focused on the study of entropic regularization in optimal transport as a smoothing method for Wasserstein estimators, through the prism of the classical tradeoff between approximation and estimation errors in statistics. Wasserstein estimators are defined as solutions of variational problems whose objective function involves the use of an optimal transport cost between probability measures. Such estimators can be regularized by replacing the optimal transport cost by its regularized version using an entropy penalty on the transport plan. The use of such a regularization has a potentially significant smoothing effect on the resulting estimators. In this work, we investigate its potential benefits on the approximation and estimation properties of regularized Wasserstein estimators. Our main contribution is to discuss how entropic regularization may reach, at a lowest computational cost, statistical performances that are comparable to those of un-regularized Wasserstein estimators in statistical learning problems involving distributional data analysis. To this end, we present new theoretical results on the convergence of regularized Wasserstein estimators. We also study their numerical performances using simulated and real data in the supervised learning problem of proportions estimation in mixture models using optimal transport.
Online Graph Topology Learning from Matrix-valued Time Series
Jul 16, 2021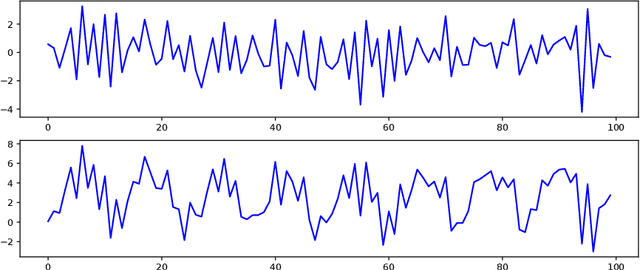


Abstract:This paper is concerned with the statistical analysis of matrix-valued time series. These are data collected over a network of sensors (typically a set of spatial locations), recording, over time, observations of multiple measurements. From such data, we propose to learn, in an online fashion, a graph that captures two aspects of dependency: one describing the sparse spatial relationship between sensors, and the other characterizing the measurement relationship. To this purpose, we introduce a novel multivariate autoregressive model to infer the graph topology encoded in the coefficient matrix which captures the sparse Granger causality dependency structure present in such matrix-valued time series. We decompose the graph by imposing a Kronecker sum structure on the coefficient matrix. We develop two online approaches to learn the graph in a recursive way. The first one uses Wald test for the projected OLS estimation, where we derive the asymptotic distribution for the estimator. For the second one, we formalize a Lasso-type optimization problem. We rely on homotopy algorithms to derive updating rules for estimating the coefficient matrix. Furthermore, we provide an adaptive tuning procedure for the regularization parameter. Numerical experiments using both synthetic and real data, are performed to support the effectiveness of the proposed learning approaches.
Sensor selection on graphs via data-driven node sub-sampling in network time series
Apr 24, 2020

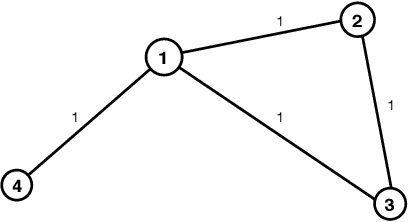
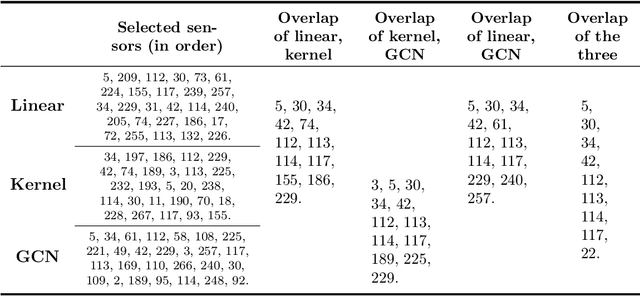
Abstract:This paper is concerned by the problem of selecting an optimal sampling set of sensors over a network of time series for the purpose of signal recovery at non-observed sensors with a minimal reconstruction error. The problem is motivated by applications where time-dependent graph signals are collected over redundant networks. In this setting, one may wish to only use a subset of sensors to predict data streams over the whole collection of nodes in the underlying graph. A typical application is the possibility to reduce the power consumption in a network of sensors that may have limited battery supplies. We propose and compare various data-driven strategies to turn off a fixed number of sensors or equivalently to select a sampling set of nodes. We also relate our approach to the existing literature on sensor selection from multivariate data with a (possibly) underlying graph structure. Our methodology combines tools from multivariate time series analysis, graph signal processing, statistical learning in high-dimension and deep learning. To illustrate the performances of our approach, we report numerical experiments on the analysis of real data from bike sharing networks in different cities.
 Add to Chrome
 Add to Firefox
 Add to Edge