Dirk Müller
Towards Unconstrained Collision Injury Protection Data Sets: Initial Surrogate Experiments for the Human Hand
Aug 12, 2024Abstract:Safety for physical human-robot interaction (pHRI) is a major concern for all application domains. While current standardization for industrial robot applications provide safety constraints that address the onset of pain in blunt impacts, these impact thresholds are difficult to use on edged or pointed impactors. The most severe injuries occur in constrained contact scenarios, where crushing is possible. Nevertheless, situations potentially resulting in constrained contact only occur in certain areas of a workspace and design or organisational approaches can be used to avoid them. What remains are risks to the human physical integrity caused by unconstrained accidental contacts, which are difficult to avoid while maintaining robot motion efficiency. Nevertheless, the probability and severity of injuries occurring with edged or pointed impacting objects in unconstrained collisions is hardly researched. In this paper, we propose an experimental setup and procedure using two pendulums modeling human hands and arms and robots to understand the injury potential of unconstrained collisions of human hands with edged objects. Based on our previous studies, we use pig feet as ex vivo surrogate samples - as these closely resemble the physiological characteristics of human hands - to create an initial injury database on the severity of injuries caused by unconstrained edged or pointed impacts. The use of such experimental setups and procedures in addition to other research on the occurrence of injuries in humans will eventually lead to a complete understanding of the biomechanical injury potential in pHRI.
Review of automated time series forecasting pipelines
Feb 03, 2022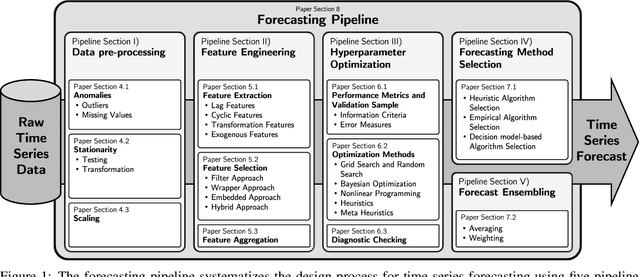
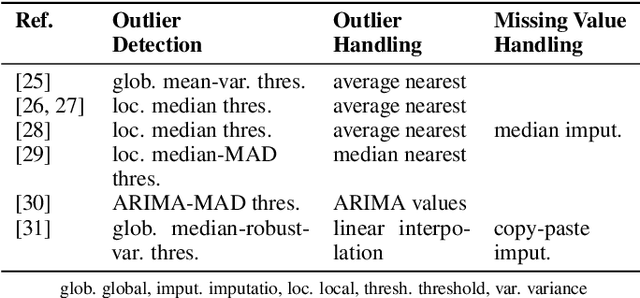
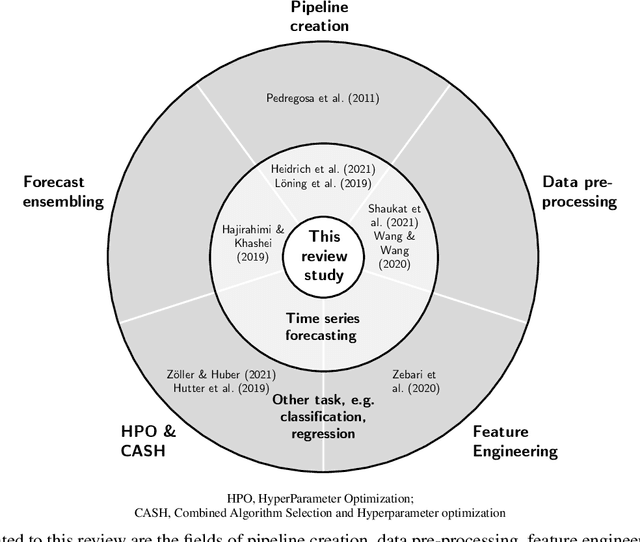
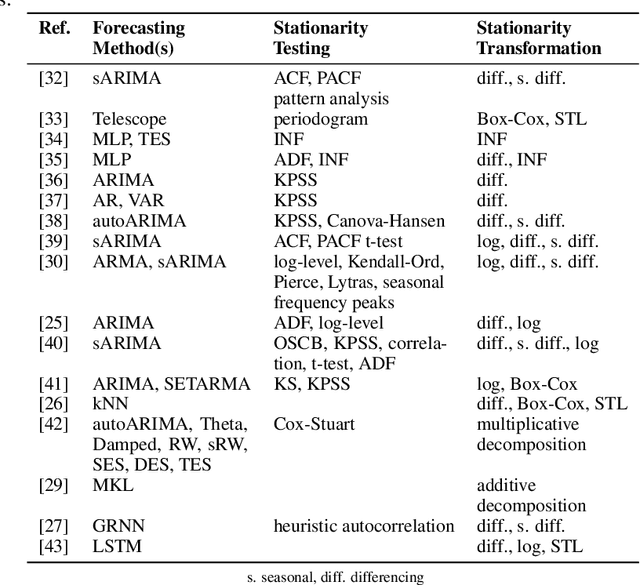
Abstract:Time series forecasting is fundamental for various use cases in different domains such as energy systems and economics. Creating a forecasting model for a specific use case requires an iterative and complex design process. The typical design process includes the five sections (1) data pre-processing, (2) feature engineering, (3) hyperparameter optimization, (4) forecasting method selection, and (5) forecast ensembling, which are commonly organized in a pipeline structure. One promising approach to handle the ever-growing demand for time series forecasts is automating this design process. The present paper, thus, analyzes the existing literature on automated time series forecasting pipelines to investigate how to automate the design process of forecasting models. Thereby, we consider both Automated Machine Learning (AutoML) and automated statistical forecasting methods in a single forecasting pipeline. For this purpose, we firstly present and compare the proposed automation methods for each pipeline section. Secondly, we analyze the automation methods regarding their interaction, combination, and coverage of the five pipeline sections. For both, we discuss the literature, identify problems, give recommendations, and suggest future research. This review reveals that the majority of papers only cover two or three of the five pipeline sections. We conclude that future research has to holistically consider the automation of the forecasting pipeline to enable the large-scale application of time series forecasting.
Automatic digital twin data model generation of building energy systems from piping and instrumentation diagrams
Aug 31, 2021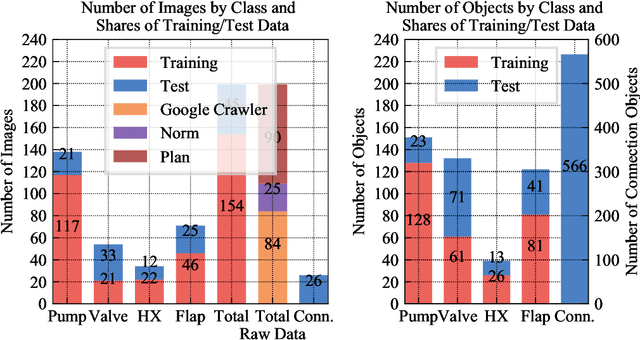
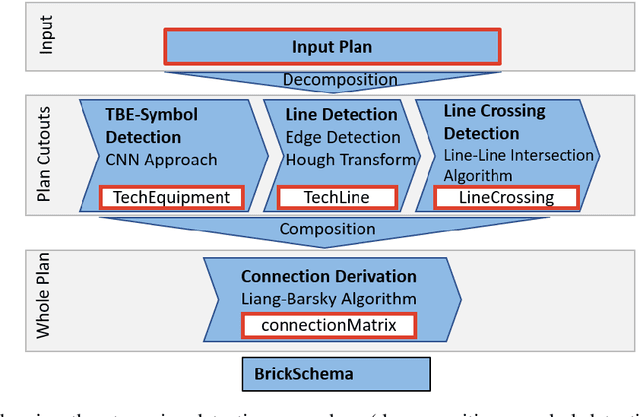
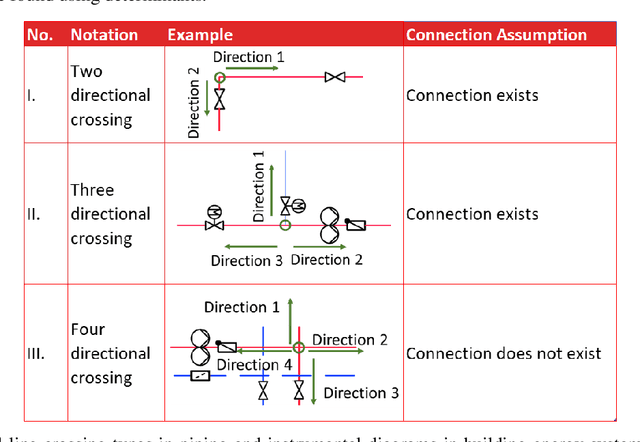
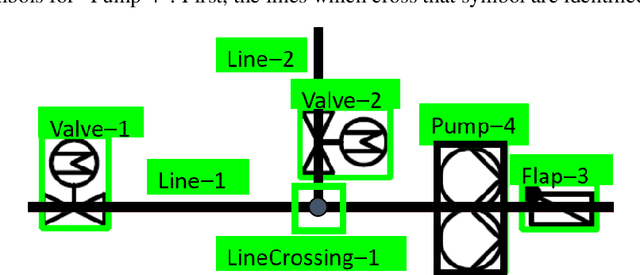
Abstract:Buildings directly and indirectly emit a large share of current CO2 emissions. There is a high potential for CO2 savings through modern control methods in building automation systems (BAS) like model predictive control (MPC). For a proper control, MPC needs mathematical models to predict the future behavior of the controlled system. For this purpose, digital twins of the building can be used. However, with current methods in existing buildings, a digital twin set up is usually labor-intensive. Especially connecting the different components of the technical system to an overall digital twin of the building is time-consuming. Piping and instrument diagrams (P&ID) can provide the needed information, but it is necessary to extract the information and provide it in a standardized format to process it further. In this work, we present an approach to recognize symbols and connections of P&ID from buildings in a completely automated way. There are various standards for graphical representation of symbols in P&ID of building energy systems. Therefore, we use different data sources and standards to generate a holistic training data set. We apply algorithms for symbol recognition, line recognition and derivation of connections to the data sets. Furthermore, the result is exported to a format that provides semantics of building energy systems. The symbol recognition, line recognition and connection recognition show good results with an average precision of 93.7%, which can be used in further processes like control generation, (distributed) model predictive control or fault detection. Nevertheless, the approach needs further research.
 Add to Chrome
 Add to Firefox
 Add to Edge