Abigail Mosca
Tufts University
RNNbow: Visualizing Learning via Backpropagation Gradients in Recurrent Neural Networks
Jul 29, 2019


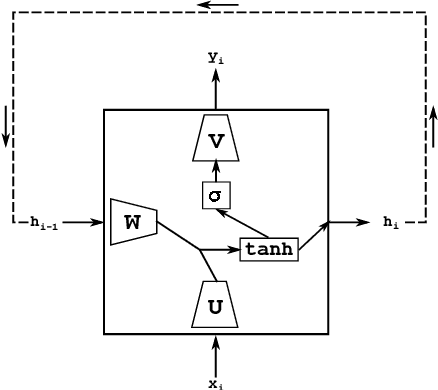
Abstract:We present RNNbow, an interactive tool for visualizing the gradient flow during backpropagation training in recurrent neural networks. RNNbow is a web application that displays the relative gradient contributions from Recurrent Neural Network (RNN) cells in a neighborhood of an element of a sequence. We describe the calculation of backpropagation through time (BPTT) that keeps track of itemized gradients, or gradient contributions from one element of a sequence to previous elements of a sequence. By visualizing the gradient, as opposed to activations, RNNbow offers insight into how the network is learning. We use it to explore the learning of an RNN that is trained to generate code in the C programming language. We show how it uncovers insights into the vanishing gradient as well as the evolution of training as the RNN works its way through a corpus.
Visual Analytics for Automated Model Discovery
Oct 02, 2018


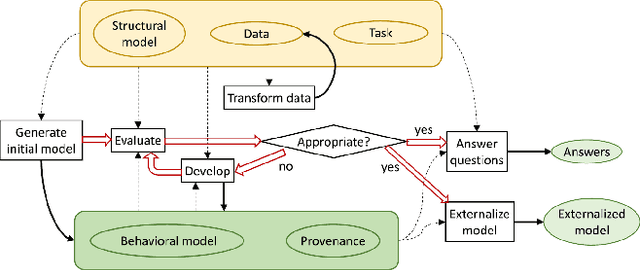
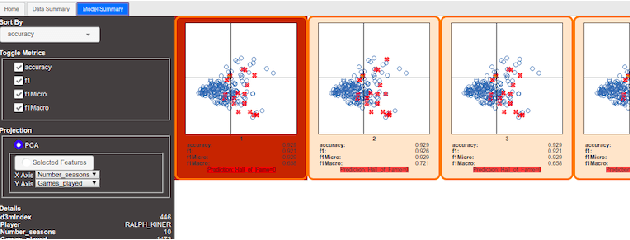
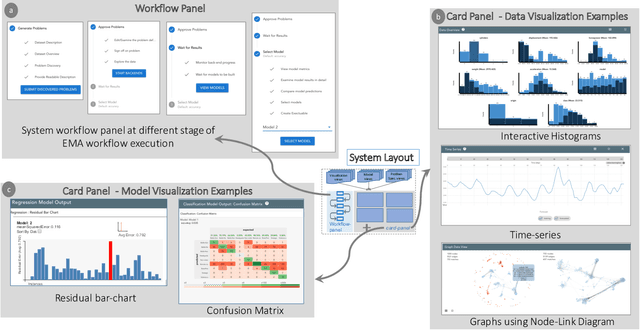
Abstract:A recent advancement in the machine learning community is the development of automated machine learning (autoML) systems, such as autoWeka or Google's Cloud AutoML, which automate the model selection and tuning process. However, while autoML tools give users access to arbitrarily complex models, they typically return those models with little context or explanation. Visual analytics can be helpful in giving a user of autoML insight into their data, and a more complete understanding of the models discovered by autoML, including differences between multiple models. In this work, we describe how visual analytics for automated model discovery differs from traditional visual analytics for machine learning. First, we propose an architecture based on an extension of existing visual analytics frameworks. Then we describe a prototype system Snowcat, developed according to the presented framework and architecture, that aids users in generating models for a diverse set of data and modeling tasks.
 Add to Chrome
 Add to Firefox
 Add to Edge