RNNbow: Visualizing Learning via Backpropagation Gradients in Recurrent Neural Networks
Paper and Code
Jul 29, 2019


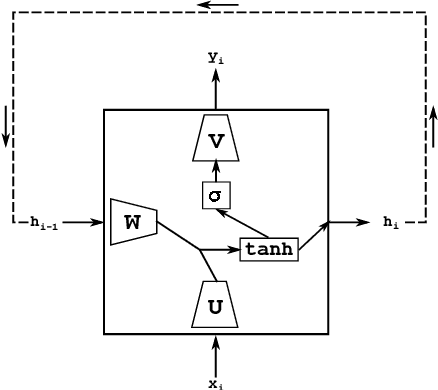
We present RNNbow, an interactive tool for visualizing the gradient flow during backpropagation training in recurrent neural networks. RNNbow is a web application that displays the relative gradient contributions from Recurrent Neural Network (RNN) cells in a neighborhood of an element of a sequence. We describe the calculation of backpropagation through time (BPTT) that keeps track of itemized gradients, or gradient contributions from one element of a sequence to previous elements of a sequence. By visualizing the gradient, as opposed to activations, RNNbow offers insight into how the network is learning. We use it to explore the learning of an RNN that is trained to generate code in the C programming language. We show how it uncovers insights into the vanishing gradient as well as the evolution of training as the RNN works its way through a corpus.
 Add to Chrome
 Add to Firefox
 Add to Edge