Romain Guigourès
SAMM
A Hierarchical Bayesian Model for Size Recommendation in Fashion
Aug 02, 2019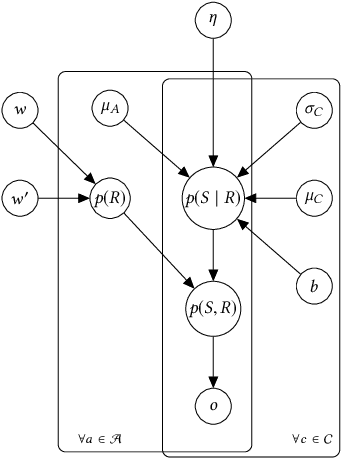

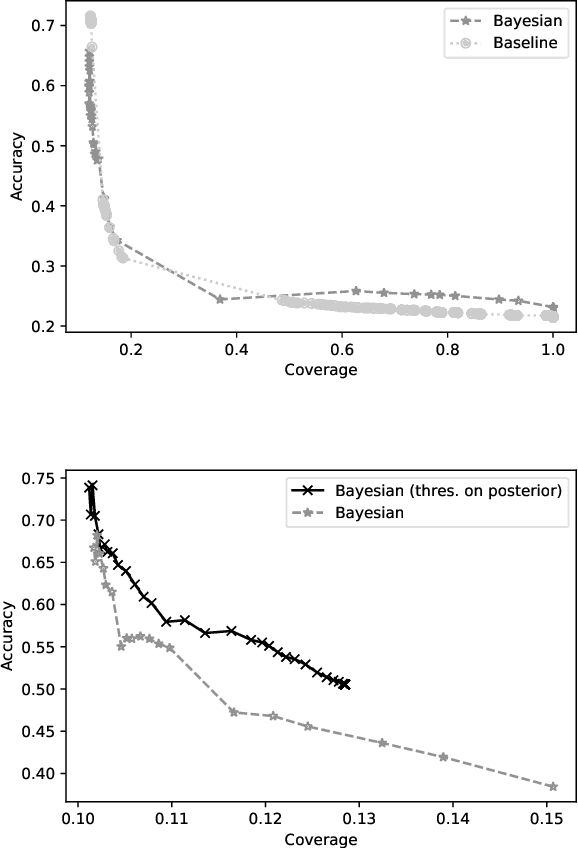
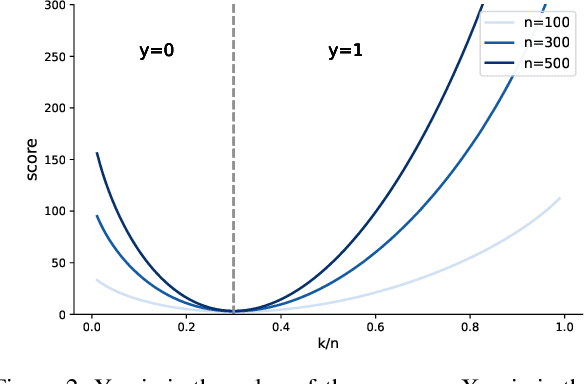
Abstract:We introduce a hierarchical Bayesian approach to tackle the challenging problem of size recommendation in e-commerce fashion. Our approach jointly models a size purchased by a customer, and its possible return event: 1. no return, 2. returned too small 3. returned too big. Those events are drawn following a multinomial distribution parameterized on the joint probability of each event, built following a hierarchy combining priors. Such a model allows us to incorporate extended domain expertise and article characteristics as prior knowledge, which in turn makes it possible for the underlying parameters to emerge thanks to sufficient data. Experiments are presented on real (anonymized) data from millions of customers along with a detailed discussion on the efficiency of such an approach within a large scale production system.
SizeNet: Weakly Supervised Learning of Visual Size and Fit in Fashion Images
May 28, 2019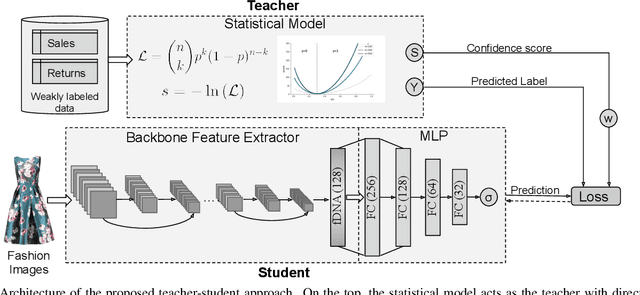
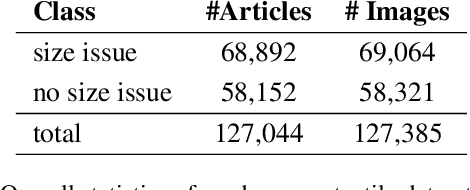
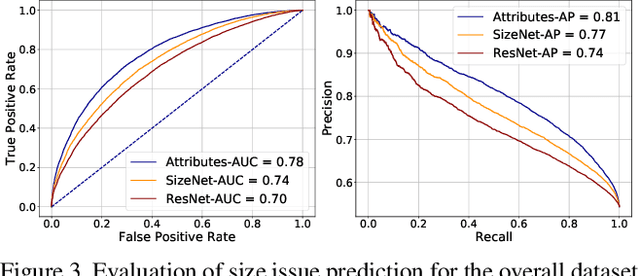
Abstract:Finding clothes that fit is a hot topic in the e-commerce fashion industry. Most approaches addressing this problem are based on statistical methods relying on historical data of articles purchased and returned to the store. Such approaches suffer from the cold start problem for the thousands of articles appearing on the shopping platforms every day, for which no prior purchase history is available. We propose to employ visual data to infer size and fit characteristics of fashion articles. We introduce SizeNet, a weakly-supervised teacher-student training framework that leverages the power of statistical models combined with the rich visual information from article images to learn visual cues for size and fit characteristics, capable of tackling the challenging cold start problem. Detailed experiments are performed on thousands of textile garments, including dresses, trousers, knitwear, tops, etc. from hundreds of different brands.
Discovering Patterns in Time-Varying Graphs: A Triclustering Approach
Aug 29, 2016


Abstract:This paper introduces a novel technique to track structures in time varying graphs. The method uses a maximum a posteriori approach for adjusting a three-dimensional co-clustering of the source vertices, the destination vertices and the time, to the data under study, in a way that does not require any hyper-parameter tuning. The three dimensions are simultaneously segmented in order to build clusters of source vertices, destination vertices and time segments where the edge distributions across clusters of vertices follow the same evolution over the time segments. The main novelty of this approach lies in that the time segments are directly inferred from the evolution of the edge distribution between the vertices, thus not requiring the user to make any a priori quantization. Experiments conducted on artificial data illustrate the good behavior of the technique, and a study of a real-life data set shows the potential of the proposed approach for exploratory data analysis.
Co-Clustering Network-Constrained Trajectory Data
Nov 04, 2015


Abstract:Recently, clustering moving object trajectories kept gaining interest from both the data mining and machine learning communities. This problem, however, was studied mainly and extensively in the setting where moving objects can move freely on the euclidean space. In this paper, we study the problem of clustering trajectories of vehicles whose movement is restricted by the underlying road network. We model relations between these trajectories and road segments as a bipartite graph and we try to cluster its vertices. We demonstrate our approaches on synthetic data and show how it could be useful in inferring knowledge about the flow dynamics and the behavior of the drivers using the road network.
A Study of the Spatio-Temporal Correlations in Mobile Calls Networks
Oct 30, 2015


Abstract:For the last few years, the amount of data has significantly increased in the companies. It is the reason why data analysis methods have to evolve to meet new demands. In this article, we introduce a practical analysis of a large database from a telecommunication operator. The problem is to segment a territory and characterize the retrieved areas owing to their inhabitant behavior in terms of mobile telephony. We have call detail records collected during five months in France. We propose a two stages analysis. The first one aims at grouping source antennas which originating calls are similarly distributed on target antennas and conversely for target antenna w.r.t. source antenna. A geographic projection of the data is used to display the results on a map of France. The second stage discretizes the time into periods between which we note changes in distributions of calls emerging from the clusters of source antennas. This enables an analysis of temporal changes of inhabitants behavior in every area of the country.
Cats & Co: Categorical Time Series Coclustering
May 06, 2015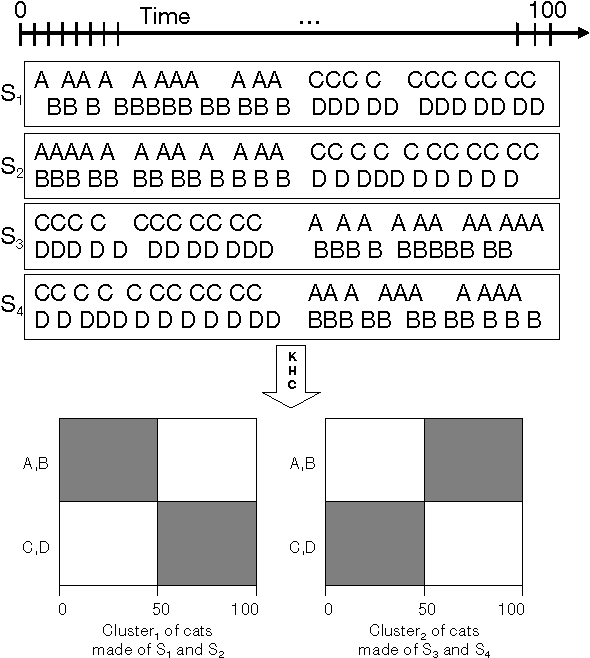
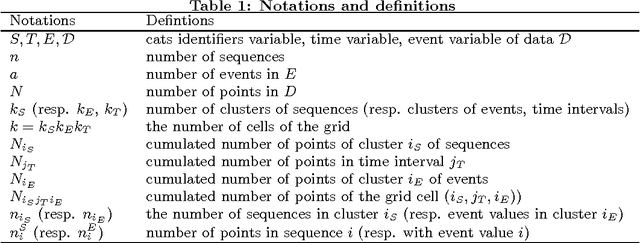
Abstract:We suggest a novel method of clustering and exploratory analysis of temporal event sequences data (also known as categorical time series) based on three-dimensional data grid models. A data set of temporal event sequences can be represented as a data set of three-dimensional points, each point is defined by three variables: a sequence identifier, a time value and an event value. Instantiating data grid models to the 3D-points turns the problem into 3D-coclustering. The sequences are partitioned into clusters, the time variable is discretized into intervals and the events are partitioned into clusters. The cross-product of the univariate partitions forms a multivariate partition of the representation space, i.e., a grid of cells and it also represents a nonparametric estimator of the joint distribution of the sequences, time and events dimensions. Thus, the sequences are grouped together because they have similar joint distribution of time and events, i.e., similar distribution of events along the time dimension. The best data grid is computed using a parameter-free Bayesian model selection approach. We also suggest several criteria for exploiting the resulting grid through agglomerative hierarchies, for interpreting the clusters of sequences and characterizing their components through insightful visualizations. Extensive experiments on both synthetic and real-world data sets demonstrate that data grid models are efficient, effective and discover meaningful underlying patterns of categorical time series data.
Country-scale Exploratory Analysis of Call Detail Records through the Lens of Data Grid Models
Mar 20, 2015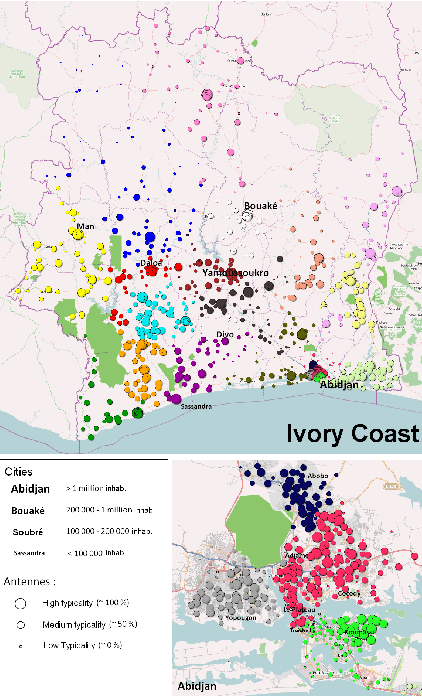
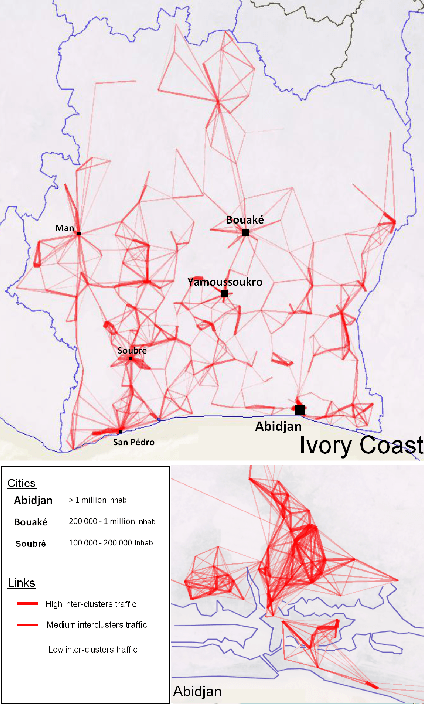
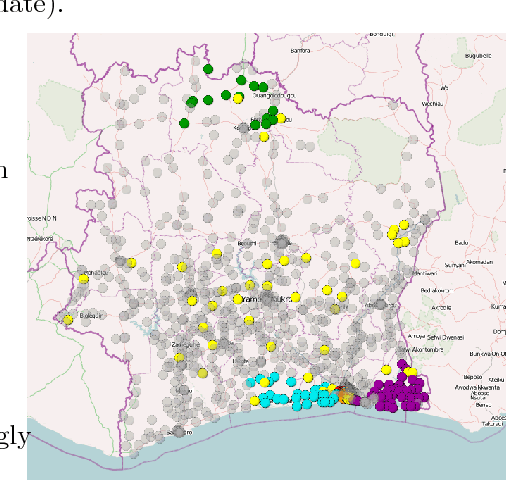
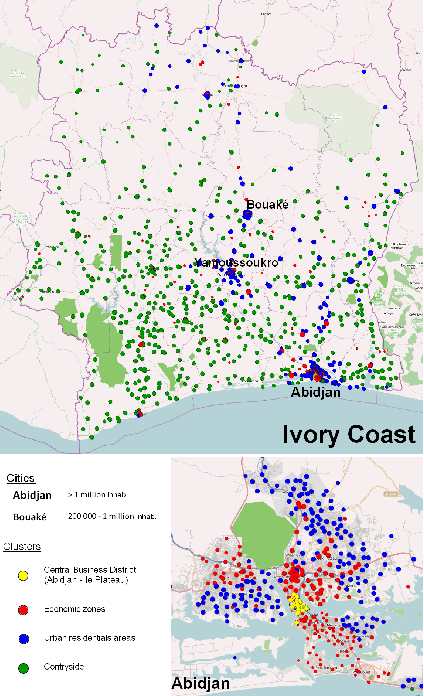
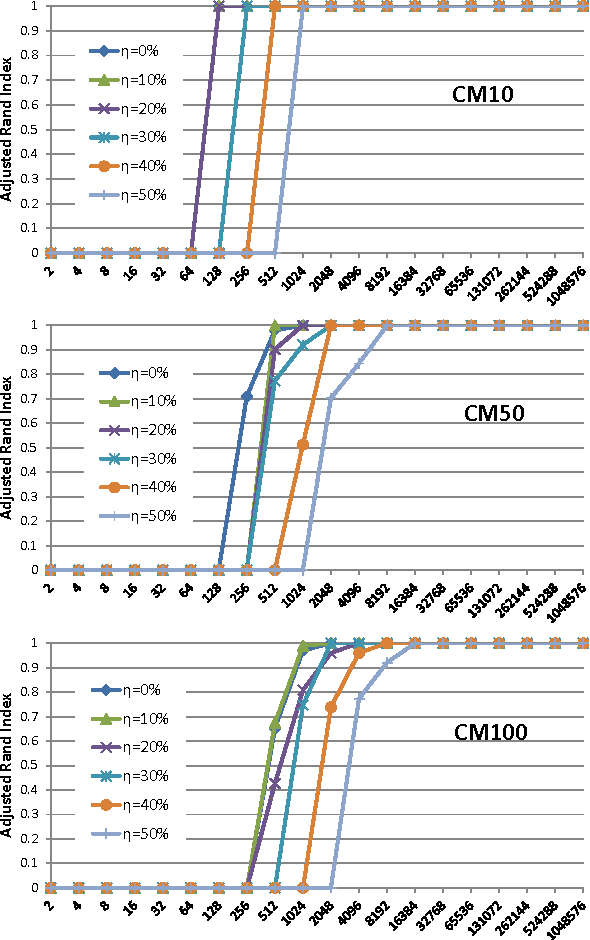
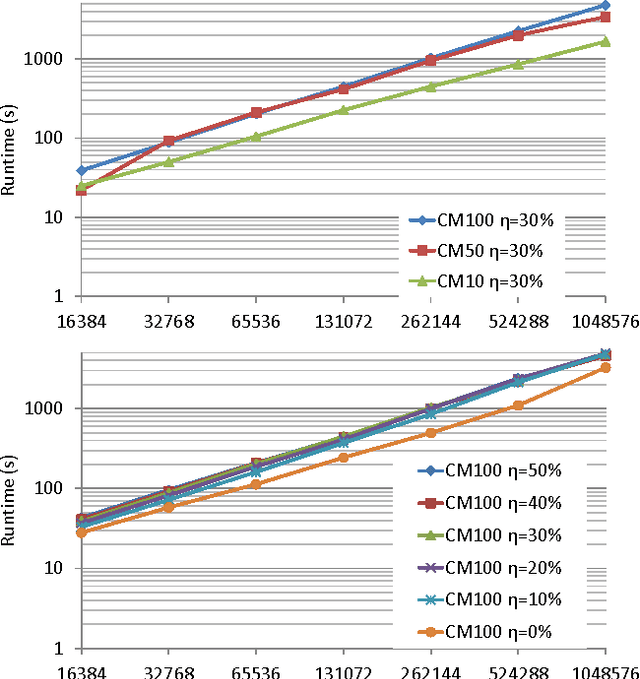
Abstract:Call Detail Records (CDRs) are data recorded by telecommunications companies, consisting of basic informations related to several dimensions of the calls made through the network: the source, destination, date and time of calls. CDRs data analysis has received much attention in the recent years since it might reveal valuable information about human behavior. It has shown high added value in many application domains like e.g., communities analysis or network planning. In this paper, we suggest a generic methodology for summarizing information contained in CDRs data. The method is based on a parameter-free estimation of the joint distribution of the variables that describe the calls. We also suggest several well-founded criteria that allows one to browse the summary at various granularities and to explore the summary by means of insightful visualizations. The method handles network graph data, temporal sequence data as well as user mobility data stemming from original CDRs data. We show the relevance of our methodology for various case studies on real-world CDRs data from Ivory Coast.
Nonparametric Hierarchical Clustering of Functional Data
Jul 02, 2014


Abstract:In this paper, we deal with the problem of curves clustering. We propose a nonparametric method which partitions the curves into clusters and discretizes the dimensions of the curve points into intervals. The cross-product of these partitions forms a data-grid which is obtained using a Bayesian model selection approach while making no assumptions regarding the curves. Finally, a post-processing technique, aiming at reducing the number of clusters in order to improve the interpretability of the clustering, is proposed. It consists in optimally merging the clusters step by step, which corresponds to an agglomerative hierarchical classification whose dissimilarity measure is the variation of the criterion. Interestingly this measure is none other than the sum of the Kullback-Leibler divergences between clusters distributions before and after the merges. The practical interest of the approach for functional data exploratory analysis is presented and compared with an alternative approach on an artificial and a real world data set.
A Triclustering Approach for Time Evolving Graphs
Jan 12, 2013


Abstract:This paper introduces a novel technique to track structures in time evolving graphs. The method is based on a parameter free approach for three-dimensional co-clustering of the source vertices, the target vertices and the time. All these features are simultaneously segmented in order to build time segments and clusters of vertices whose edge distributions are similar and evolve in the same way over the time segments. The main novelty of this approach lies in that the time segments are directly inferred from the evolution of the edge distribution between the vertices, thus not requiring the user to make an a priori discretization. Experiments conducted on a synthetic dataset illustrate the good behaviour of the technique, and a study of a real-life dataset shows the potential of the proposed approach for exploratory data analysis.
 Add to Chrome
 Add to Firefox
 Add to Edge