Dominique Gay
LIM
Kriging and Gaussian Process Interpolation for Georeferenced Data Augmentation
Jan 13, 2025


Abstract:Data augmentation is a crucial step in the development of robust supervised learning models, especially when dealing with limited datasets. This study explores interpolation techniques for the augmentation of geo-referenced data, with the aim of predicting the presence of Commelina benghalensis L. in sugarcane plots in La R{\'e}union. Given the spatial nature of the data and the high cost of data collection, we evaluated two interpolation approaches: Gaussian processes (GPs) with different kernels and kriging with various variograms. The objectives of this work are threefold: (i) to identify which interpolation methods offer the best predictive performance for various regression algorithms, (ii) to analyze the evolution of performance as a function of the number of observations added, and (iii) to assess the spatial consistency of augmented datasets. The results show that GP-based methods, in particular with combined kernels (GP-COMB), significantly improve the performance of regression algorithms while requiring less additional data. Although kriging shows slightly lower performance, it is distinguished by a more homogeneous spatial coverage, a potential advantage in certain contexts.
Automatic Feature Engineering for Time Series Classification: Evaluation and Discussion
Aug 02, 2023


Abstract:Time Series Classification (TSC) has received much attention in the past two decades and is still a crucial and challenging problem in data science and knowledge engineering. Indeed, along with the increasing availability of time series data, many TSC algorithms have been suggested by the research community in the literature. Besides state-of-the-art methods based on similarity measures, intervals, shapelets, dictionaries, deep learning methods or hybrid ensemble methods, several tools for extracting unsupervised informative summary statistics, aka features, from time series have been designed in the recent years. Originally designed for descriptive analysis and visualization of time series with informative and interpretable features, very few of these feature engineering tools have been benchmarked for TSC problems and compared with state-of-the-art TSC algorithms in terms of predictive performance. In this article, we aim at filling this gap and propose a simple TSC process to evaluate the potential predictive performance of the feature sets obtained with existing feature engineering tools. Thus, we present an empirical study of 11 feature engineering tools branched with 9 supervised classifiers over 112 time series data sets. The analysis of the results of more than 10000 learning experiments indicate that feature-based methods perform as accurately as current state-of-the-art TSC algorithms, and thus should rightfully be considered further in the TSC literature.
Interpretable Feature Construction for Time Series Extrinsic Regression
Mar 15, 2021


Abstract:Supervised learning of time series data has been extensively studied for the case of a categorical target variable. In some application domains, e.g., energy, environment and health monitoring, it occurs that the target variable is numerical and the problem is known as time series extrinsic regression (TSER). In the literature, some well-known time series classifiers have been extended for TSER problems. As first benchmarking studies have focused on predictive performance, very little attention has been given to interpretability. To fill this gap, in this paper, we suggest an extension of a Bayesian method for robust and interpretable feature construction and selection in the context of TSER. Our approach exploits a relational way to tackle with TSER: (i), we build various and simple representations of the time series which are stored in a relational data scheme, then, (ii), a propositionalisation technique (based on classical aggregation / selection functions from the relational data field) is applied to build interpretable features from secondary tables to "flatten" the data; and (iii), the constructed features are filtered out through a Bayesian Maximum A Posteriori approach. The resulting transformed data can be processed with various existing regressors. Experimental validation on various benchmark data sets demonstrates the benefits of the suggested approach.
Predictive K-means with local models
Dec 16, 2020


Abstract:Supervised classification can be effective for prediction but sometimes weak on interpretability or explainability (XAI). Clustering, on the other hand, tends to isolate categories or profiles that can be meaningful but there is no guarantee that they are useful for labels prediction. Predictive clustering seeks to obtain the best of the two worlds. Starting from labeled data, it looks for clusters that are as pure as possible with regards to the class labels. One technique consists in tweaking a clustering algorithm so that data points sharing the same label tend to aggregate together. With distance-based algorithms, such as k-means, a solution is to modify the distance used by the algorithm so that it incorporates information about the labels of the data points. In this paper, we propose another method which relies on a change of representation guided by class densities and then carries out clustering in this new representation space. We present two new algorithms using this technique and show on a variety of data sets that they are competitive for prediction performance with pure supervised classifiers while offering interpretability of the clusters discovered.
Should we Reload Time Series Classification Performance Evaluation ? (a position paper)
Mar 08, 2019Abstract:Since the introduction and the public availability of the \textsc{ucr} time series benchmark data sets, numerous Time Series Classification (TSC) methods has been designed, evaluated and compared to each others. We suggest a critical view of TSC performance evaluation protocols put in place in recent TSC literature. The main goal of this `position' paper is to stimulate discussion and reflexion about performance evaluation in TSC literature.
* 8 pages
Cats & Co: Categorical Time Series Coclustering
May 06, 2015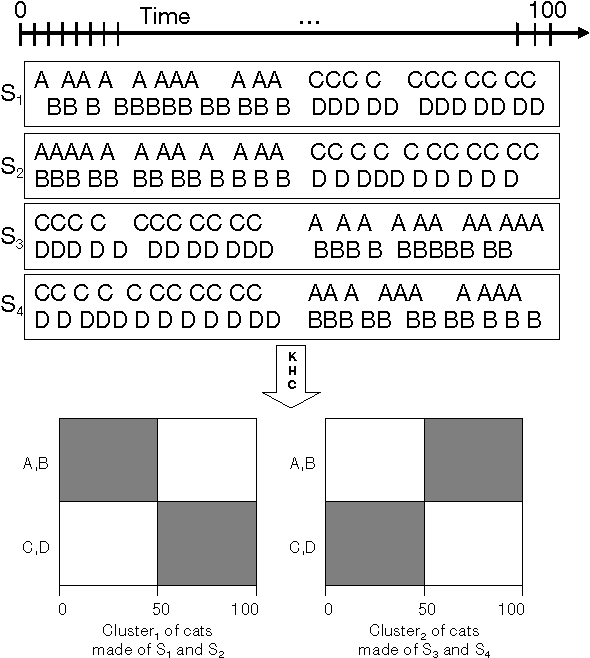
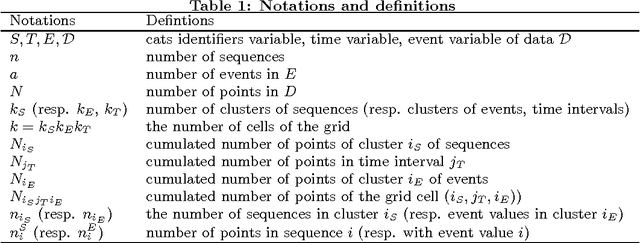
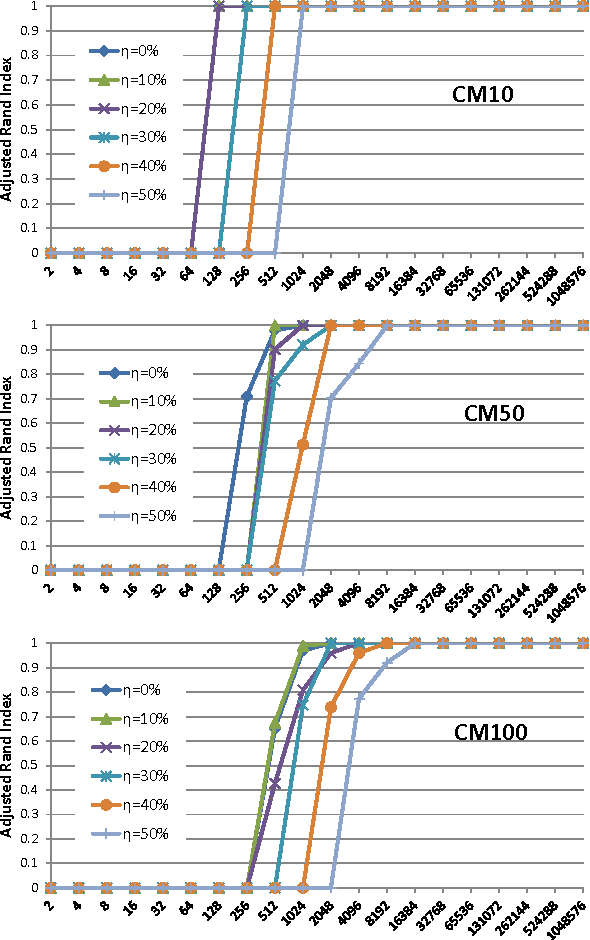
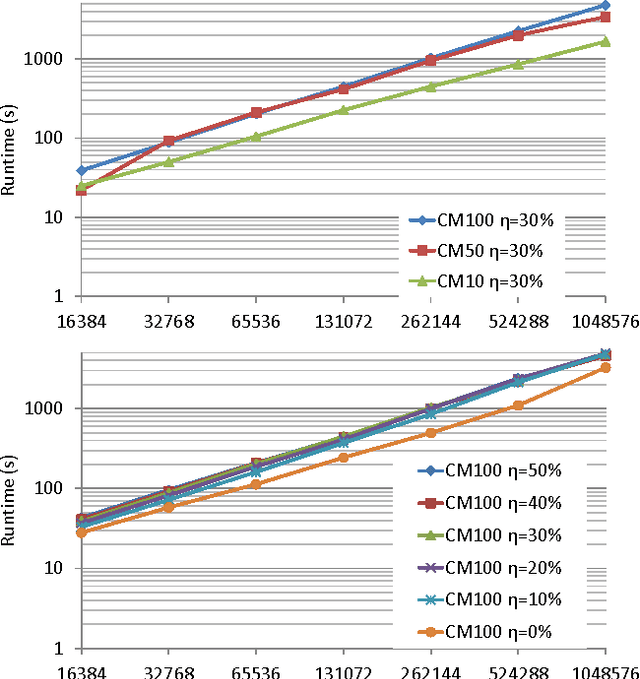
Abstract:We suggest a novel method of clustering and exploratory analysis of temporal event sequences data (also known as categorical time series) based on three-dimensional data grid models. A data set of temporal event sequences can be represented as a data set of three-dimensional points, each point is defined by three variables: a sequence identifier, a time value and an event value. Instantiating data grid models to the 3D-points turns the problem into 3D-coclustering. The sequences are partitioned into clusters, the time variable is discretized into intervals and the events are partitioned into clusters. The cross-product of the univariate partitions forms a multivariate partition of the representation space, i.e., a grid of cells and it also represents a nonparametric estimator of the joint distribution of the sequences, time and events dimensions. Thus, the sequences are grouped together because they have similar joint distribution of time and events, i.e., similar distribution of events along the time dimension. The best data grid is computed using a parameter-free Bayesian model selection approach. We also suggest several criteria for exploiting the resulting grid through agglomerative hierarchies, for interpreting the clusters of sequences and characterizing their components through insightful visualizations. Extensive experiments on both synthetic and real-world data sets demonstrate that data grid models are efficient, effective and discover meaningful underlying patterns of categorical time series data.
Country-scale Exploratory Analysis of Call Detail Records through the Lens of Data Grid Models
Mar 20, 2015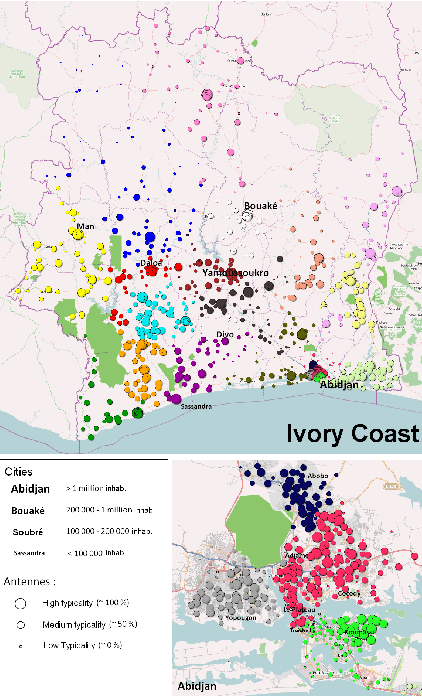
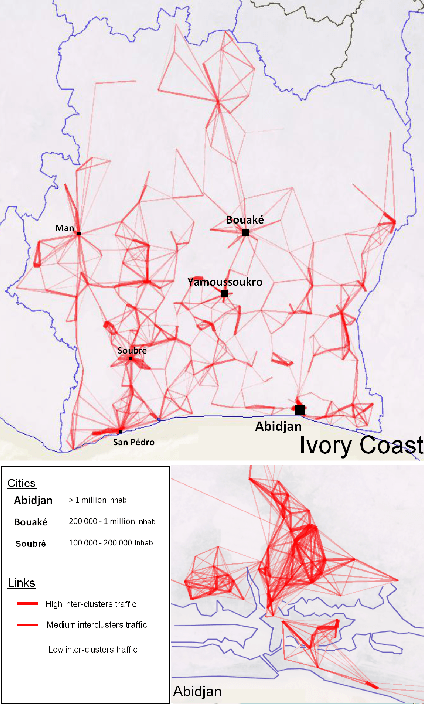
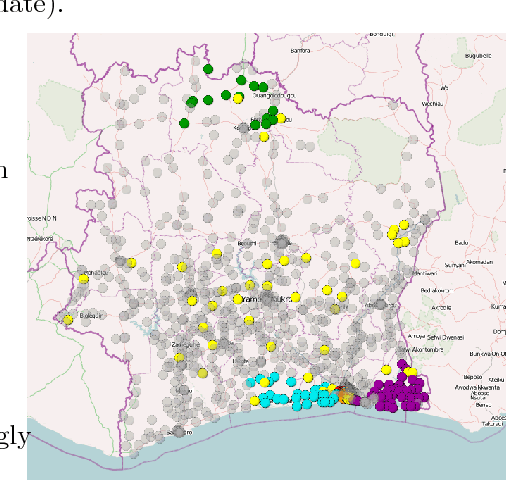
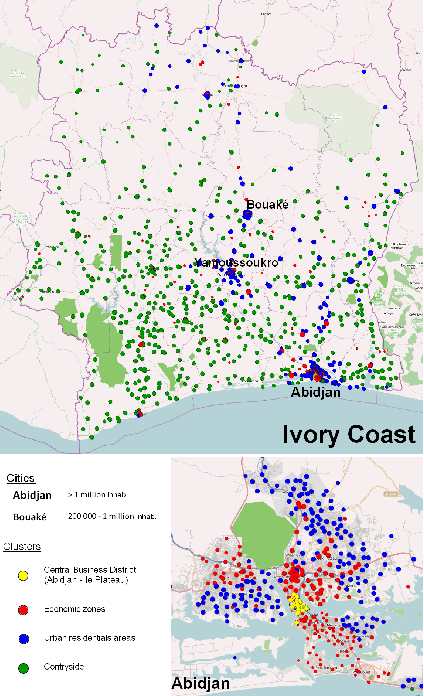
Abstract:Call Detail Records (CDRs) are data recorded by telecommunications companies, consisting of basic informations related to several dimensions of the calls made through the network: the source, destination, date and time of calls. CDRs data analysis has received much attention in the recent years since it might reveal valuable information about human behavior. It has shown high added value in many application domains like e.g., communities analysis or network planning. In this paper, we suggest a generic methodology for summarizing information contained in CDRs data. The method is based on a parameter-free estimation of the joint distribution of the variables that describe the calls. We also suggest several well-founded criteria that allows one to browse the summary at various granularities and to explore the summary by means of insightful visualizations. The method handles network graph data, temporal sequence data as well as user mobility data stemming from original CDRs data. We show the relevance of our methodology for various case studies on real-world CDRs data from Ivory Coast.
 Add to Chrome
 Add to Firefox
 Add to Edge