Nicolas Goix
LTCI
One Class Splitting Criteria for Random Forests
Nov 21, 2016
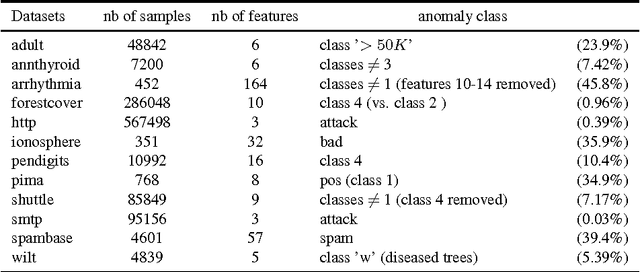
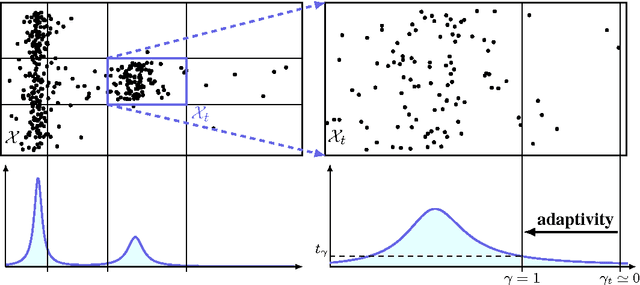
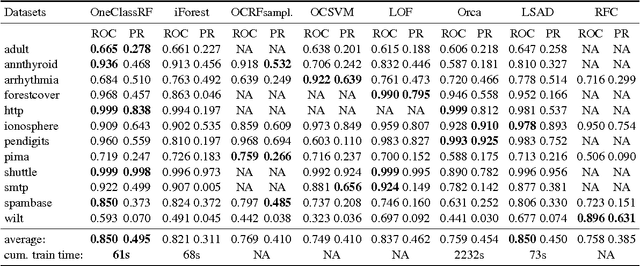
Abstract:Random Forests (RFs) are strong machine learning tools for classification and regression. However, they remain supervised algorithms, and no extension of RFs to the one-class setting has been proposed, except for techniques based on second-class sampling. This work fills this gap by proposing a natural methodology to extend standard splitting criteria to the one-class setting, structurally generalizing RFs to one-class classification. An extensive benchmark of seven state-of-the-art anomaly detection algorithms is also presented. This empirically demonstrates the relevance of our approach.
How to Evaluate the Quality of Unsupervised Anomaly Detection Algorithms?
Jul 05, 2016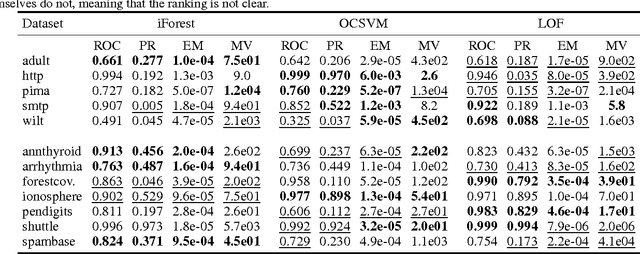
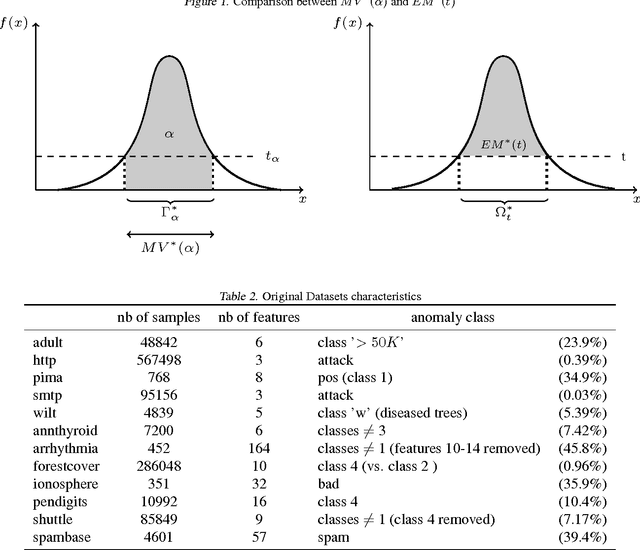
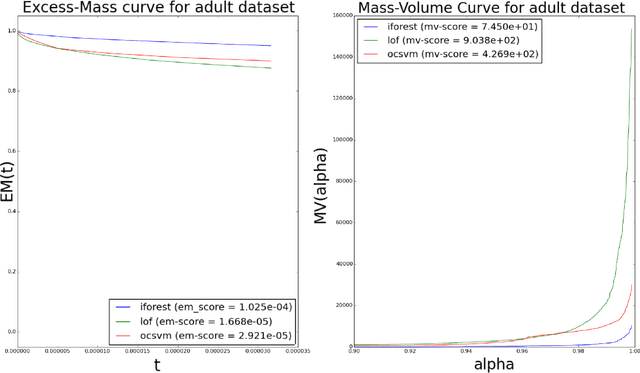
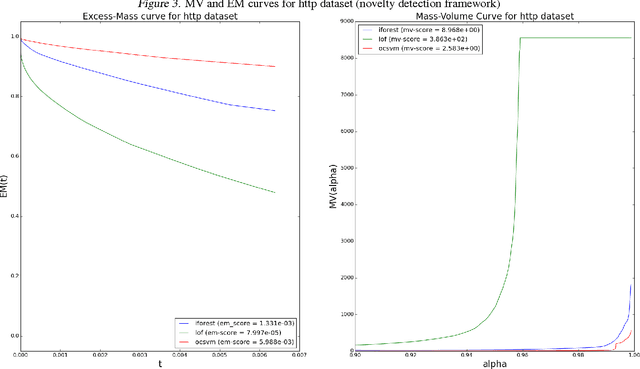
Abstract:When sufficient labeled data are available, classical criteria based on Receiver Operating Characteristic (ROC) or Precision-Recall (PR) curves can be used to compare the performance of un-supervised anomaly detection algorithms. However , in many situations, few or no data are labeled. This calls for alternative criteria one can compute on non-labeled data. In this paper, two criteria that do not require labels are empirically shown to discriminate accurately (w.r.t. ROC or PR based criteria) between algorithms. These criteria are based on existing Excess-Mass (EM) and Mass-Volume (MV) curves, which generally cannot be well estimated in large dimension. A methodology based on feature sub-sampling and aggregating is also described and tested, extending the use of these criteria to high-dimensional datasets and solving major drawbacks inherent to standard EM and MV curves.
Sparse Representation of Multivariate Extremes with Applications to Anomaly Ranking
Mar 31, 2016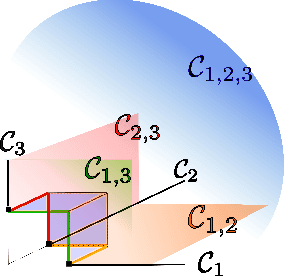
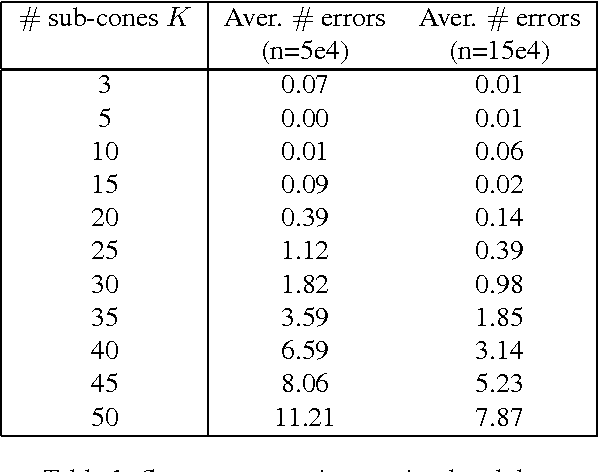
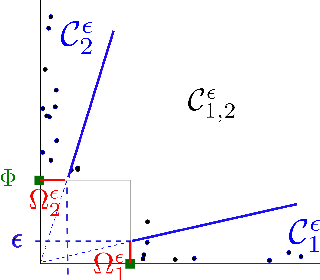
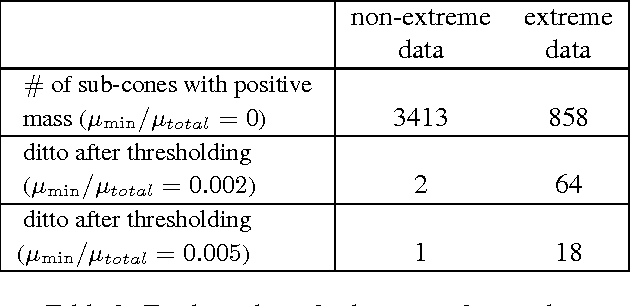
Abstract:Extremes play a special role in Anomaly Detection. Beyond inference and simulation purposes, probabilistic tools borrowed from Extreme Value Theory (EVT), such as the angular measure, can also be used to design novel statistical learning methods for Anomaly Detection/ranking. This paper proposes a new algorithm based on multivariate EVT to learn how to rank observations in a high dimensional space with respect to their degree of 'abnormality'. The procedure relies on an original dimension-reduction technique in the extreme domain that possibly produces a sparse representation of multivariate extremes and allows to gain insight into the dependence structure thereof, escaping the curse of dimensionality. The representation output by the unsupervised methodology we propose here can be combined with any Anomaly Detection technique tailored to non-extreme data. As it performs linearly with the dimension and almost linearly in the data (in O(dn log n)), it fits to large scale problems. The approach in this paper is novel in that EVT has never been used in its multivariate version in the field of Anomaly Detection. Illustrative experimental results provide strong empirical evidence of the relevance of our approach.
Sparsity in Multivariate Extremes with Applications to Anomaly Detection
Mar 14, 2016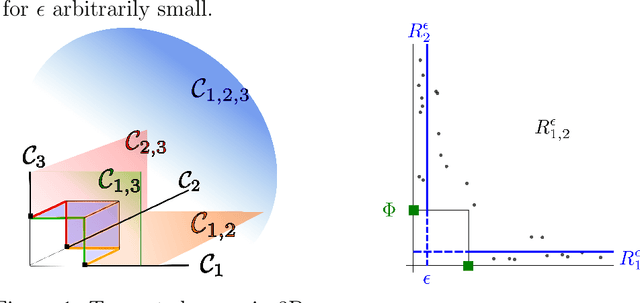


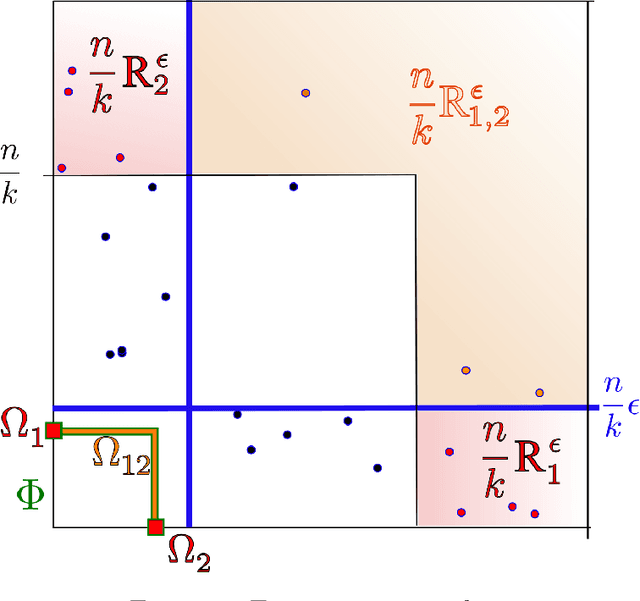
Abstract:Capturing the dependence structure of multivariate extreme events is a major concern in many fields involving the management of risks stemming from multiple sources, e.g. portfolio monitoring, insurance, environmental risk management and anomaly detection. One convenient (non-parametric) characterization of extremal dependence in the framework of multivariate Extreme Value Theory (EVT) is the angular measure, which provides direct information about the probable 'directions' of extremes, that is, the relative contribution of each feature/coordinate of the 'largest' observations. Modeling the angular measure in high dimensional problems is a major challenge for the multivariate analysis of rare events. The present paper proposes a novel methodology aiming at exhibiting a sparsity pattern within the dependence structure of extremes. This is done by estimating the amount of mass spread by the angular measure on representative sets of directions, corresponding to specific sub-cones of $R^d\_+$. This dimension reduction technique paves the way towards scaling up existing multivariate EVT methods. Beyond a non-asymptotic study providing a theoretical validity framework for our method, we propose as a direct application a --first-- anomaly detection algorithm based on multivariate EVT. This algorithm builds a sparse 'normal profile' of extreme behaviours, to be confronted with new (possibly abnormal) extreme observations. Illustrative experimental results provide strong empirical evidence of the relevance of our approach.
On Anomaly Ranking and Excess-Mass Curves
Feb 05, 2015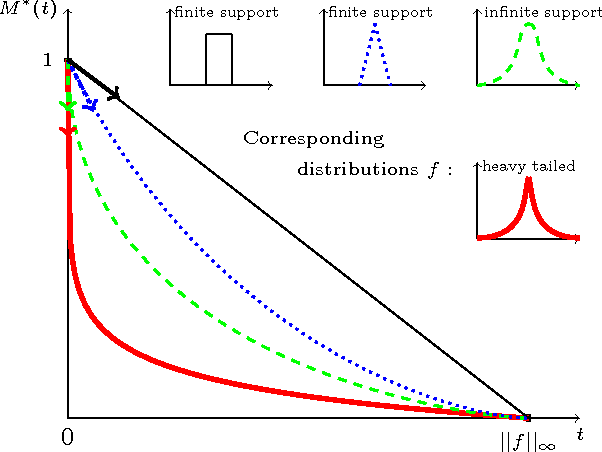
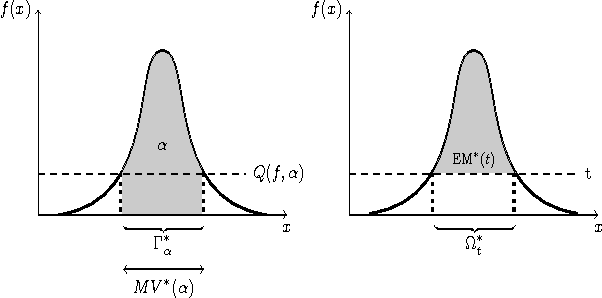
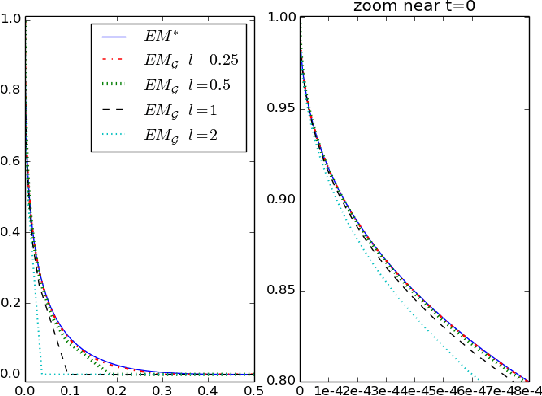
Abstract:Learning how to rank multivariate unlabeled observations depending on their degree of abnormality/novelty is a crucial problem in a wide range of applications. In practice, it generally consists in building a real valued "scoring" function on the feature space so as to quantify to which extent observations should be considered as abnormal. In the 1-d situation, measurements are generally considered as "abnormal" when they are remote from central measures such as the mean or the median. Anomaly detection then relies on tail analysis of the variable of interest. Extensions to the multivariate setting are far from straightforward and it is precisely the main purpose of this paper to introduce a novel and convenient (functional) criterion for measuring the performance of a scoring function regarding the anomaly ranking task, referred to as the Excess-Mass curve (EM curve). In addition, an adaptive algorithm for building a scoring function based on unlabeled data X1 , . . . , Xn with a nearly optimal EM is proposed and is analyzed from a statistical perspective.
 Add to Chrome
 Add to Firefox
 Add to Edge