 Add to Chrome
 Add to Firefox
 Add to Edge
Deep learning enables urban change profiling through alignment of historical maps
Feb 02, 2026Prior to modern Earth observation technologies, historical maps provide a unique record of long-term urban transformation and offer a lens on the evolving identity of cities. However, extracting consistent and fine-grained change information from historical map series remains challenging due to spatial misalignment, cartographic variation, and degrading document quality, limiting most analyses to small-scale or qualitative approaches. We propose a fully automated, deep learning-based framework for fine-grained urban change analysis from large collections of historical maps, built on a modular design that integrates dense map alignment, multi-temporal object detection, and change profiling. This framework shifts the analysis of historical maps from ad hoc visual comparison toward systematic, quantitative characterization of urban change. Experiments demonstrate the robust performance of the proposed alignment and object detection methods. Applied to Paris between 1868 and 1937, the framework reveals the spatial and temporal heterogeneity in urban transformation, highlighting its relevance for research in the social sciences and humanities. The modular design of our framework further supports adaptation to diverse cartographic contexts and downstream applications.
ICDAR 2021 Competition on Historical Map Segmentation
May 27, 2021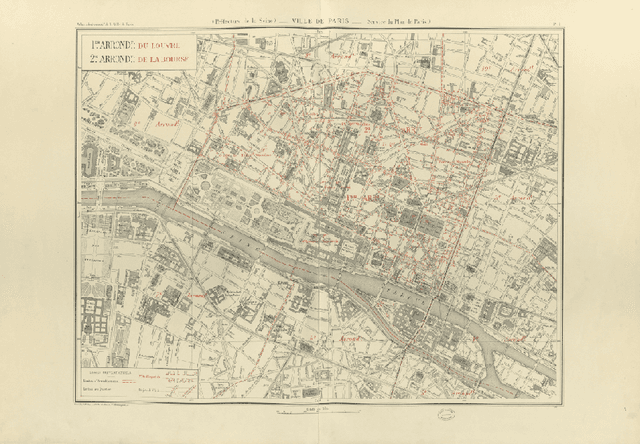

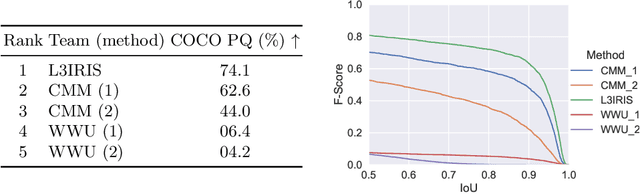
This paper presents the final results of the ICDAR 2021 Competition on Historical Map Segmentation (MapSeg), encouraging research on a series of historical atlases of Paris, France, drawn at 1/5000 scale between 1894 and 1937. The competition featured three tasks, awarded separately. Task~1 consists in detecting building blocks and was won by the L3IRIS team using a DenseNet-121 network trained in a weakly supervised fashion. This task is evaluated on 3 large images containing hundreds of shapes to detect. Task~2 consists in segmenting map content from the larger map sheet, and was won by the UWB team using a U-Net-like FCN combined with a binarization method to increase detection edge accuracy. Task~3 consists in locating intersection points of geo-referencing lines, and was also won by the UWB team who used a dedicated pipeline combining binarization, line detection with Hough transform, candidate filtering, and template matching for intersection refinement. Tasks~2 and~3 are evaluated on 95 map sheets with complex content. Dataset, evaluation tools and results are available under permissive licensing at \url{https://icdar21-mapseg.github.io/}.
Combining Deep Learning and Mathematical Morphology for Historical Map Segmentation
Jan 06, 2021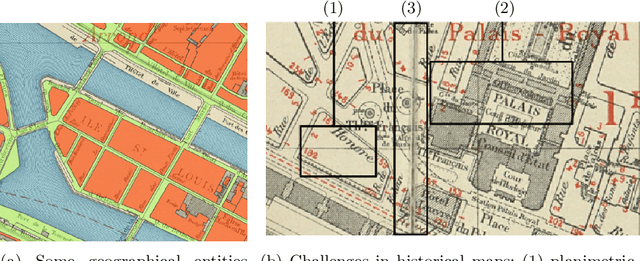
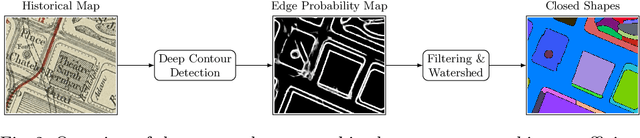
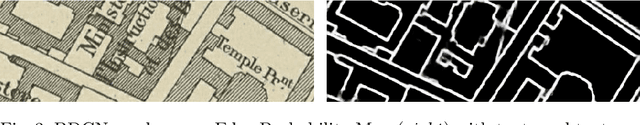
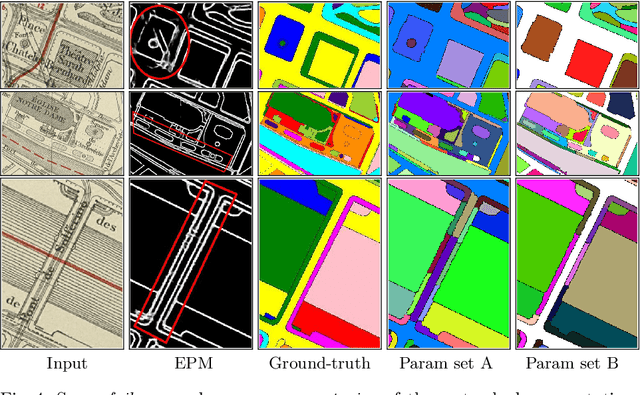
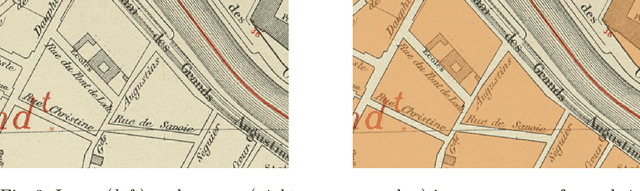
The digitization of historical maps enables the study of ancient, fragile, unique, and hardly accessible information sources. Main map features can be retrieved and tracked through the time for subsequent thematic analysis. The goal of this work is the vectorization step, i.e., the extraction of vector shapes of the objects of interest from raster images of maps. We are particularly interested in closed shape detection such as buildings, building blocks, gardens, rivers, etc. in order to monitor their temporal evolution. Historical map images present significant pattern recognition challenges. The extraction of closed shapes by using traditional Mathematical Morphology (MM) is highly challenging due to the overlapping of multiple map features and texts. Moreover, state-of-the-art Convolutional Neural Networks (CNN) are perfectly designed for content image filtering but provide no guarantee about closed shape detection. Also, the lack of textural and color information of historical maps makes it hard for CNN to detect shapes that are represented by only their boundaries. Our contribution is a pipeline that combines the strengths of CNN (efficient edge detection and filtering) and MM (guaranteed extraction of closed shapes) in order to achieve such a task. The evaluation of our approach on a public dataset shows its effectiveness for extracting the closed boundaries of objects in historical maps.
A state of the art of urban reconstruction: street, street network, vegetation, urban feature
Jan 18, 2018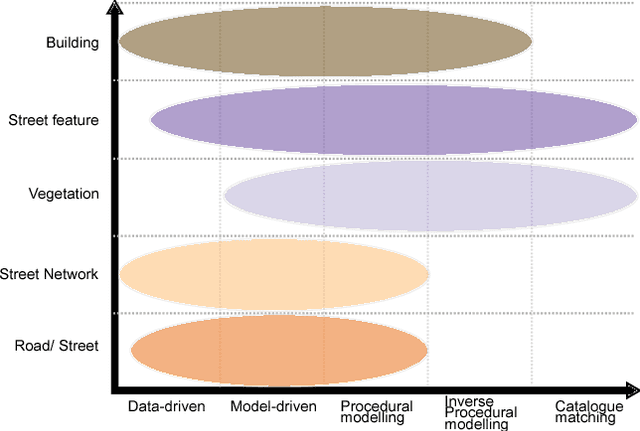
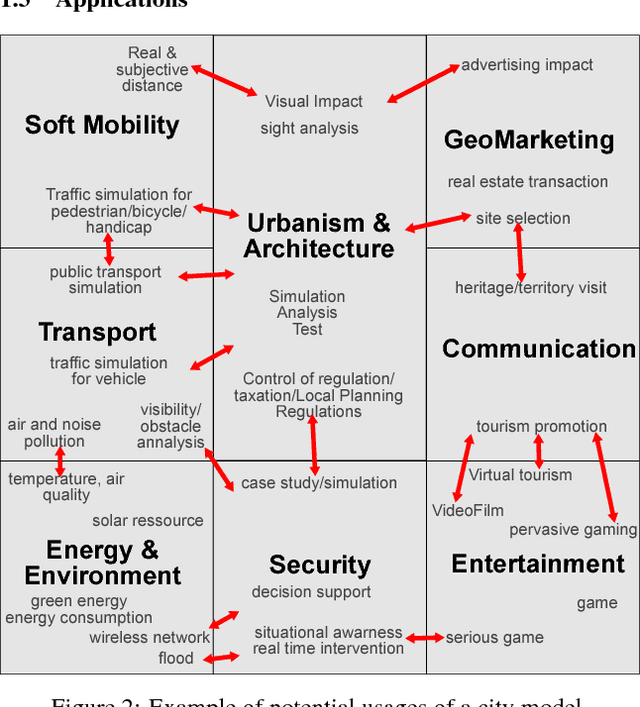
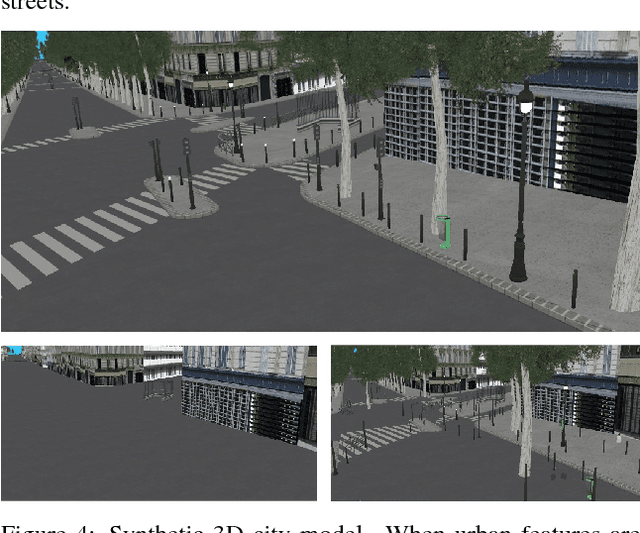
World population is raising, especially the part of people living in cities. With increased population and complex roles regarding their inhabitants and their surroundings, cities concentrate difficulties for design, planning and analysis. These tasks require a way to reconstruct/model a city. Traditionally, much attention has been given to buildings reconstruction, yet an essential part of city were neglected: streets. Streets reconstruction has been seldom researched. Streets are also complex compositions of urban features, and have a unique role for transportation (as they comprise roads). We aim at completing the recent state of the art for building reconstruction (Musialski2012) by considering all other aspect of urban reconstruction. We introduce the need for city models. Because reconstruction always necessitates data, we first analyse which data are available. We then expose a state of the art of street reconstruction, street network reconstruction, urban features reconstruction/modelling, vegetation , and urban objects reconstruction/modelling. Although reconstruction strategies vary widely, we can order them by the role the model plays, from data driven approach, to model-based approach, to inverse procedural modelling and model catalogue matching. The main challenges seems to come from the complex nature of urban environment and from the limitations of the available data. Urban features have strong relationships, between them, and to their surrounding, as well as in hierarchical relations. Procedural modelling has the power to express these relations, and could be applied to the reconstruction of urban features via the Inverse Procedural Modelling paradigm.
Interactive in-base street model edit: how common GIS software and a database can serve as a custom Graphical User Interface
Jan 17, 2018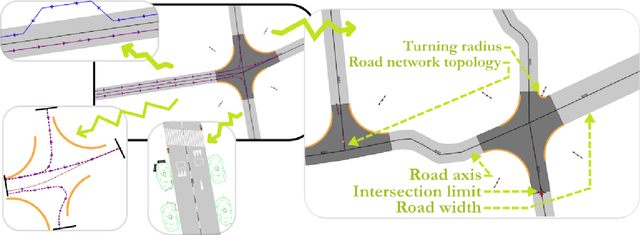
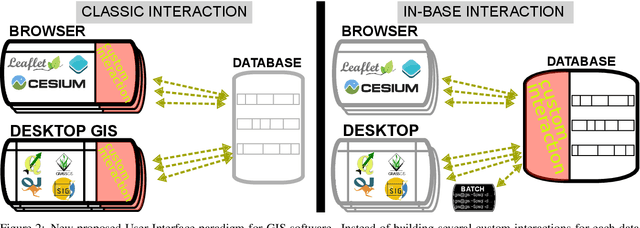
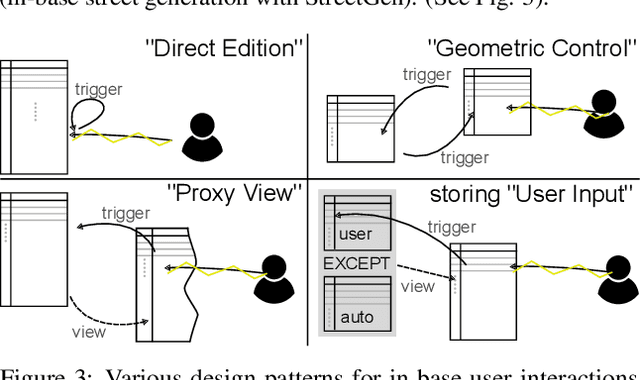
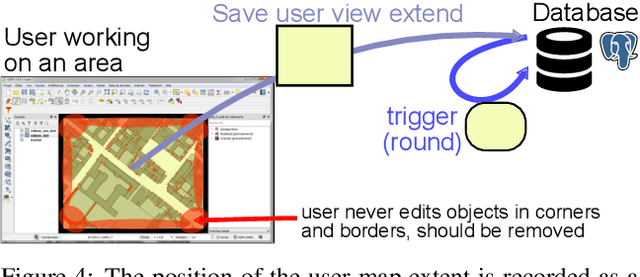
Our modern world produces an increasing quantity of data, and especially geospatial data, with advance of sensing technologies, and growing complexity and organisation of vector data. Tools are needed to efficiently create and edit those vector geospatial data. Procedural generation has been a tool of choice to generate strongly organised data, yet it may be hard to control. Because those data may be involved to take consequence-full real life decisions, user interactions are required to check data and edit it. The classical process to do so would be to build an adhoc Graphical User Interface (GUI) tool adapted for the model and method being used. This task is difficult, takes a large amount of resources, and is very specific to one model, making it hard to share and re-use. Besides, many common generic GUI already exists to edit vector data, each having its specialities. We propose a change of paradigm; instead of building a specific tool for one task, we use common GIS software as GUIs, and deport the specific interactions from the software to within the database. In this paradigm, GIS software simply modify geometry and attributes of database layers, and those changes are used by the database to perform automated task. This new paradigm has many advantages. The first one is genericity. With in-base interaction, any GIS software can be used to perform edition, whatever the software is a Desktop sofware or a web application. The second is concurrency and coherency. Because interaction is in-base, use of database features allows seamless multi-user work, and can guarantee that the data is in a coherent state. Last we propose tools to facilitate multi-user edits, both during the edit phase (each user knows what areas are edited by other users), and before and after edit (planning of edit, analyse of edited areas).
An octree cells occupancy geometric dimensionality descriptor for massive on-server point cloud visualisation and classification
Jan 15, 2018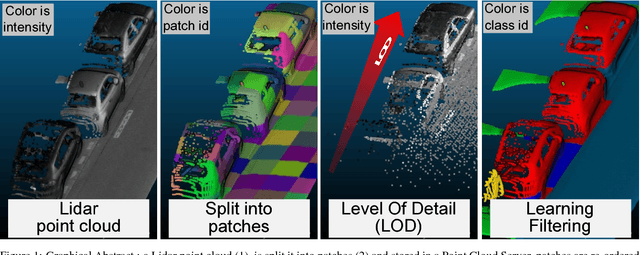
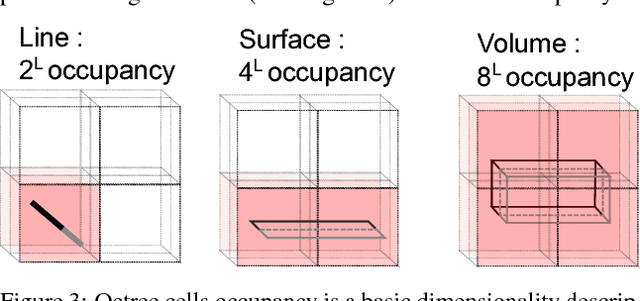
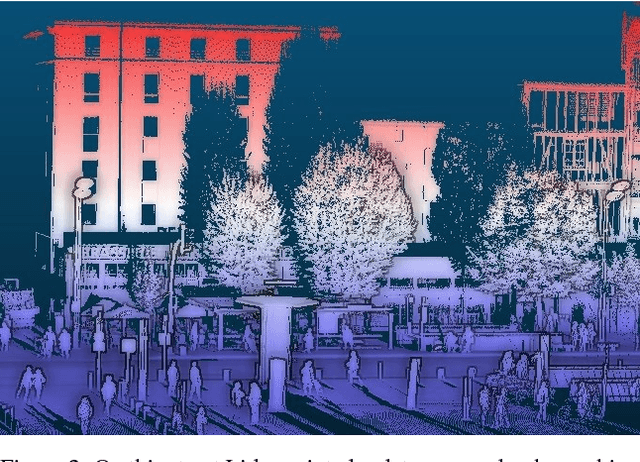
Lidar datasets are becoming more and more common. They are appreciated for their precise 3D nature, and have a wide range of applications, such as surface reconstruction, object detection, visualisation, etc. For all this applications, having additional semantic information per point has potential of increasing the quality and the efficiency of the application. In the last decade the use of Machine Learning and more specifically classification methods have proved to be successful to create this semantic information. In this paradigm, the goal is to classify points into a set of given classes (for instance tree, building, ground, other). Some of these methods use descriptors (also called feature) of a point to learn and predict its class. Designing the descriptors is then the heart of these methods. Descriptors can be based on points geometry and attributes, use contextual information, etc. Furthermore, descriptors can be used by humans for easier visual understanding and sometimes filtering. In this work we propose a new simple geometric descriptor that gives information about the implicit local dimensionality of the point cloud at various scale. For instance a tree seen from afar is more volumetric in nature (3D), yet locally each leaves is rather planar (2D). To do so we build an octree centred on the point to consider, and compare the variation of the occupancy of the cells across the levels of the octree. We compare this descriptor with the state of the art dimensionality descriptor and show its interest. We further test the descriptor for classification within the Point Cloud Server, and demonstrate efficiency and correctness results.
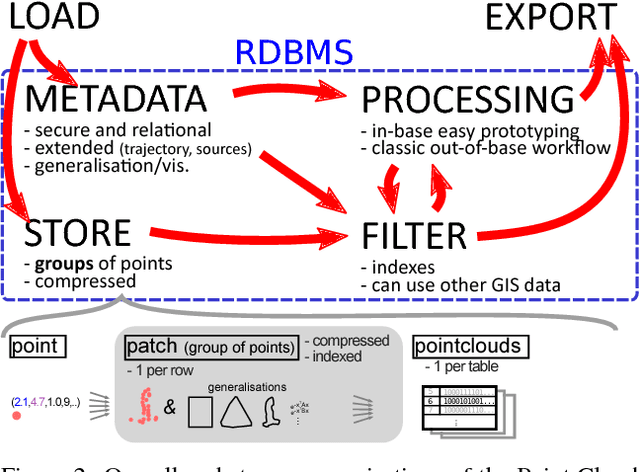
Implicit LOD using points ordering for processing and visualisation in Point Cloud Servers
Jan 11, 2018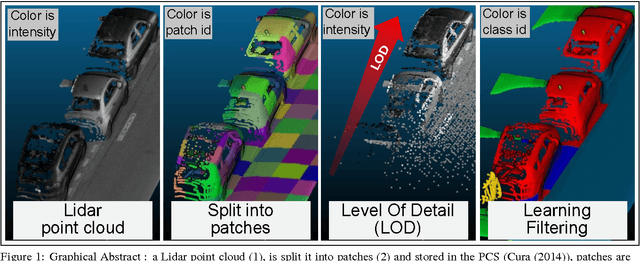
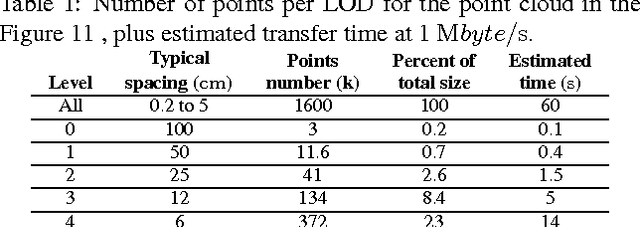
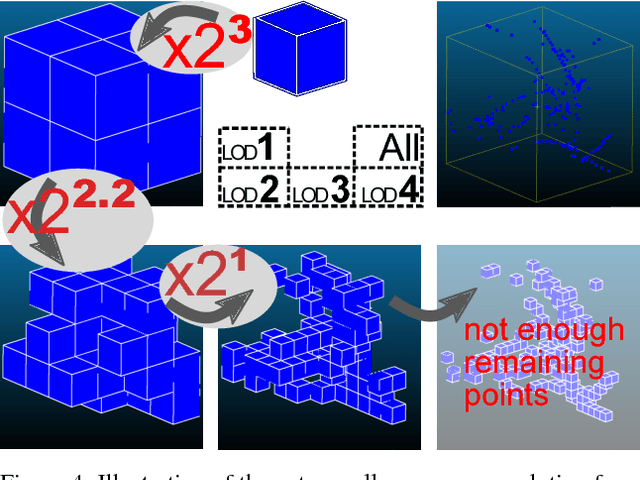
Lidar datasets now commonly reach Billions of points and are very dense. Using these point cloud becomes challenging, as the high number of points is intractable for most applications and for visualisation.In this work we propose a new paradigm to easily get a portable geometric Level Of Details (LOD) inside a Point Cloud Server.The main idea is to not store the LOD information in an external additional file, but instead to store it implicitly by exploiting the order of the points.The point cloud is divided into groups (patches). These patches are ordered so that their order gradually provides more and more details on the patch. We demonstrate the interest of our method with several classical uses of LOD, such as visualisation of massive point cloud, algorithm acceleration, fast density peak detection and correction.