Hyung-Kwon Ko
ChatGPT in Data Visualization Education: A Student Perspective
May 01, 2024


Abstract:Unlike traditional educational chatbots that rely on pre-programmed responses, large-language model-driven chatbots, such as ChatGPT, demonstrate remarkable versatility and have the potential to serve as a dynamic resource for addressing student needs from understanding advanced concepts to solving complex problems. This work explores the impact of such technology on student learning in an interdisciplinary, project-oriented data visualization course. Throughout the semester, students engaged with ChatGPT across four distinct projects, including data visualizations and implementing them using a variety of tools including Tableau, D3, and Vega-lite. We collected conversation logs and reflection surveys from the students after each assignment. In addition, we conducted interviews with selected students to gain deeper insights into their overall experiences with ChatGPT. Our analysis examined the advantages and barriers of using ChatGPT, students' querying behavior, the types of assistance sought, and its impact on assignment outcomes and engagement. Based on the findings, we discuss design considerations for an educational solution that goes beyond the basic interface of ChatGPT, specifically tailored for data visualization education.
ZADU: A Python Library for Evaluating the Reliability of Dimensionality Reduction Embeddings
Aug 11, 2023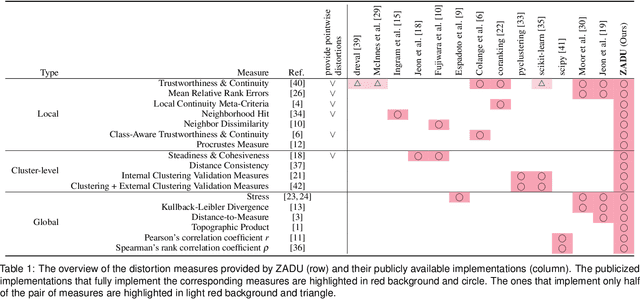

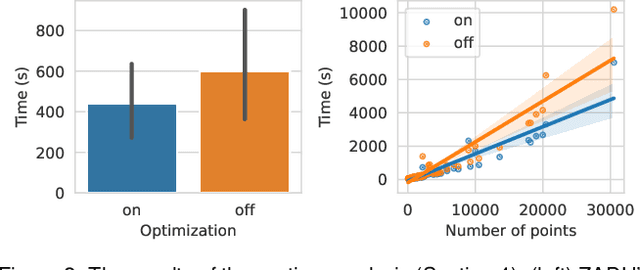
Abstract:Dimensionality reduction (DR) techniques inherently distort the original structure of input high-dimensional data, producing imperfect low-dimensional embeddings. Diverse distortion measures have thus been proposed to evaluate the reliability of DR embeddings. However, implementing and executing distortion measures in practice has so far been time-consuming and tedious. To address this issue, we present ZADU, a Python library that provides distortion measures. ZADU is not only easy to install and execute but also enables comprehensive evaluation of DR embeddings through three key features. First, the library covers a wide range of distortion measures. Second, it automatically optimizes the execution of distortion measures, substantially reducing the running time required to execute multiple measures. Last, the library informs how individual points contribute to the overall distortions, facilitating the detailed analysis of DR embeddings. By simulating a real-world scenario of optimizing DR embeddings, we verify that our optimization scheme substantially reduces the time required to execute distortion measures. Finally, as an application of ZADU, we present another library called ZADUVis that allows users to easily create distortion visualizations that depict the extent to which each region of an embedding suffers from distortions.
Uniform Manifold Approximation with Two-phase Optimization
May 01, 2022


Abstract:We introduce Uniform Manifold Approximation with Two-phase Optimization (UMATO), a dimensionality reduction (DR) technique that improves UMAP to capture the global structure of high-dimensional data more accurately. In UMATO, optimization is divided into two phases so that the resulting embeddings can depict the global structure reliably while preserving the local structure with sufficient accuracy. As the first phase, hub points are identified and projected to construct a skeletal layout for the global structure. In the second phase, the remaining points are added to the embedding preserving the regional characteristics of local areas. Through quantitative experiments, we found that UMATO (1) outperformed widely used DR techniques in preserving the global structure while (2) producing competitive accuracy in representing the local structure. We also verified that UMATO is preferable in terms of robustness over diverse initialization methods, number of epochs, and subsampling techniques.
Distortion-Aware Brushing for Interactive Cluster Analysis in Multidimensional Projections
Jan 17, 2022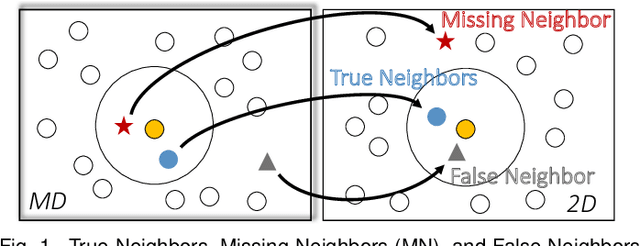
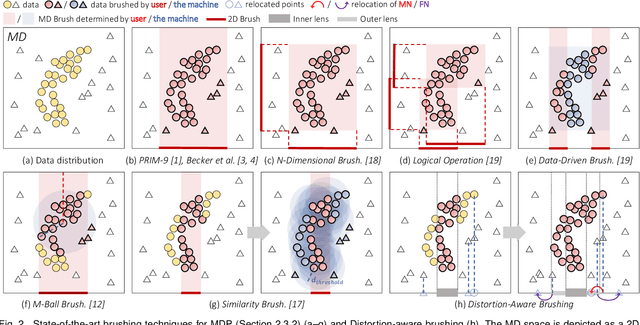
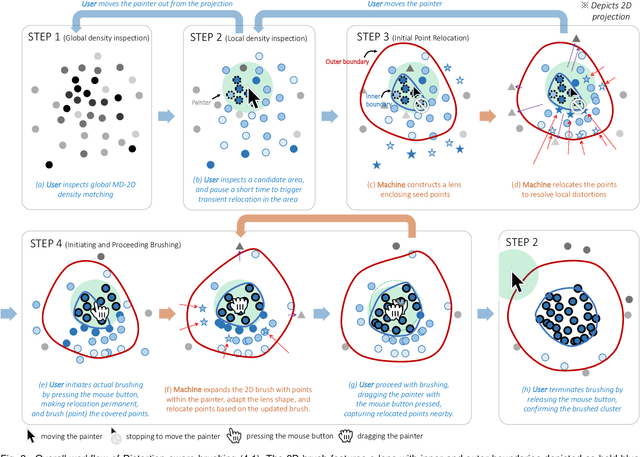
Abstract:Brushing is an everyday interaction in 2D scatterplots, which allows users to select and filter data points within a continuous, enclosed region and conduct further analysis on the points. However, such conventional brushing cannot be directly applied to Multidimensional Projections (MDP), as they hardly escape from False and Missing Neighbors distortions that make the relative positions of the points unreliable. To alleviate this problem, we introduce Distortion-aware brushing, a novel brushing technique for MDP. While users perform brushing, Distortion-aware brushing resolves distortions around currently brushed points by dynamically relocating points in the projection; the points whose data are close to the brushed data in the multidimensional (MD) space go near the corresponding brushed points in the projection, and the opposites move away. Hence, users can overcome distortions and readily extract out clustered data in the MD space using the technique. We demonstrate the effectiveness and applicability of Distortion-aware brushing through usage scenarios with two datasets. Finally, by conducting user studies with 30 participants, we verified that Distortion-aware brushing significantly outperforms previous brushing techniques in precisely separating clusters in the MD space, and works robustly regardless of the types or the amount of distortions in MDP.
Measuring and Explaining the Inter-Cluster Reliability of Multidimensional Projections
Jul 22, 2021
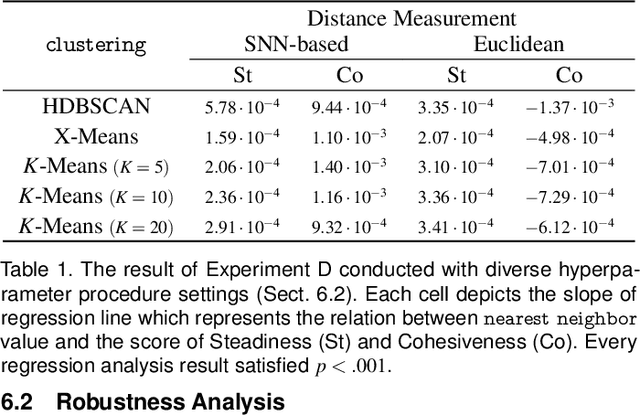
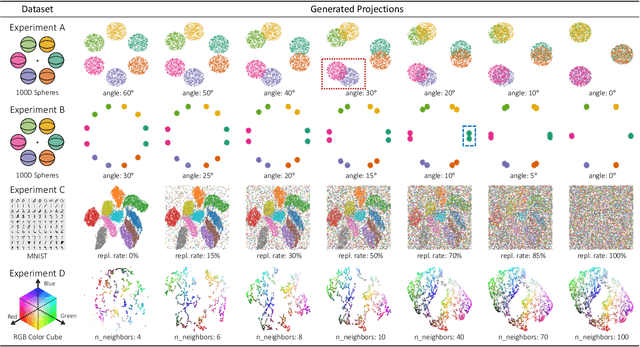
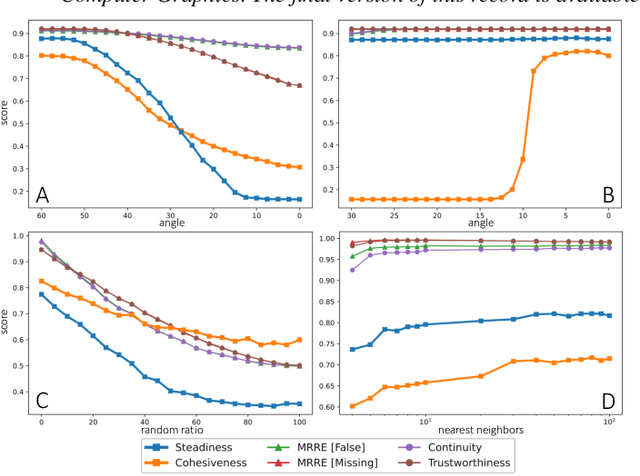
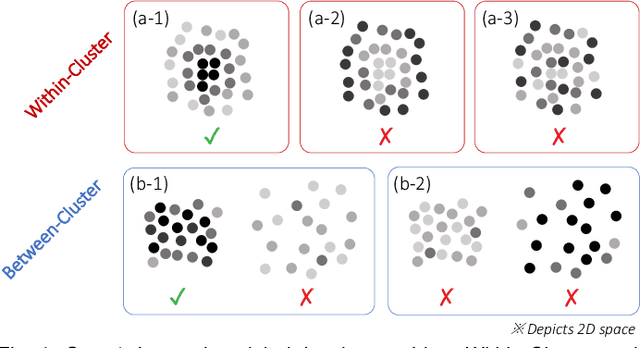
Abstract:We propose Steadiness and Cohesiveness, two novel metrics to measure the inter-cluster reliability of multidimensional projection (MDP), specifically how well the inter-cluster structures are preserved between the original high-dimensional space and the low-dimensional projection space. Measuring inter-cluster reliability is crucial as it directly affects how well inter-cluster tasks (e.g., identifying cluster relationships in the original space from a projected view) can be conducted; however, despite the importance of inter-cluster tasks, we found that previous metrics, such as Trustworthiness and Continuity, fail to measure inter-cluster reliability. Our metrics consider two aspects of the inter-cluster reliability: Steadiness measures the extent to which clusters in the projected space form clusters in the original space, and Cohesiveness measures the opposite. They extract random clusters with arbitrary shapes and positions in one space and evaluate how much the clusters are stretched or dispersed in the other space. Furthermore, our metrics can quantify pointwise distortions, allowing for the visualization of inter-cluster reliability in a projection, which we call a reliability map. Through quantitative experiments, we verify that our metrics precisely capture the distortions that harm inter-cluster reliability while previous metrics have difficulty capturing the distortions. A case study also demonstrates that our metrics and the reliability map 1) support users in selecting the proper projection techniques or hyperparameters and 2) prevent misinterpretation while performing inter-cluster tasks, thus allow an adequate identification of inter-cluster structure.
 Add to Chrome
 Add to Firefox
 Add to Edge