Dinesh Singh
SPOT-Face: Forensic Face Identification using Attention Guided Optimal Transport
Jan 14, 2026Abstract:Person identification in forensic investigations becomes very challenging when common identification means for DNA (i.e., hair strands, soft tissue) are not available. Current methods utilize deep learning methods for face recognition. However, these methods lack effective mechanisms to model cross-domain structural correspondence between two different forensic modalities. In this paper, we introduce a SPOT-Face, a superpixel graph-based framework designed for cross-domain forensic face identification of victims using their skeleton and sketch images. Our unified framework involves constructing a superpixel-based graph from an image and then using different graph neural networks(GNNs) backbones to extract the embeddings of these graphs, while cross-domain correspondence is established through attention-guided optimal transport mechanism. We have evaluated our proposed framework on two publicly available dataset: IIT\_Mandi\_S2F (S2F) and CUFS. Extensive experiments were conducted to evaluate our proposed framework. The experimental results show significant improvement in identification metrics ( i.e., Recall, mAP) over existing graph-based baselines. Furthermore, our framework demonstrates to be highly effective for matching skulls and sketches to faces in forensic investigations.
Cranio-ID: Graph-Based Craniofacial Identification via Automatic Landmark Annotation in 2D Multi-View X-rays
Nov 18, 2025Abstract:In forensic craniofacial identification and in many biomedical applications, craniometric landmarks are important. Traditional methods for locating landmarks are time-consuming and require specialized knowledge and expertise. Current methods utilize superimposition and deep learning-based methods that employ automatic annotation of landmarks. However, these methods are not reliable due to insufficient large-scale validation studies. In this paper, we proposed a novel framework Cranio-ID: First, an automatic annotation of landmarks on 2D skulls (which are X-ray scans of faces) with their respective optical images using our trained YOLO-pose models. Second, cross-modal matching by formulating these landmarks into graph representations and then finding semantic correspondence between graphs of these two modalities using cross-attention and optimal transport framework. Our proposed framework is validated on the S2F and CUHK datasets (CUHK dataset resembles with S2F dataset). Extensive experiments have been conducted to evaluate the performance of our proposed framework, which demonstrates significant improvements in both reliability and accuracy, as well as its effectiveness in cross-domain skull-to-face and sketch-to-face matching in forensic science.
FCR: Investigating Generative AI models for Forensic Craniofacial Reconstruction
Aug 25, 2025Abstract:Craniofacial reconstruction in forensics is one of the processes to identify victims of crime and natural disasters. Identifying an individual from their remains plays a crucial role when all other identification methods fail. Traditional methods for this task, such as clay-based craniofacial reconstruction, require expert domain knowledge and are a time-consuming process. At the same time, other probabilistic generative models like the statistical shape model or the Basel face model fail to capture the skull and face cross-domain attributes. Looking at these limitations, we propose a generic framework for craniofacial reconstruction from 2D X-ray images. Here, we used various generative models (i.e., CycleGANs, cGANs, etc) and fine-tune the generator and discriminator parts to generate more realistic images in two distinct domains, which are the skull and face of an individual. This is the first time where 2D X-rays are being used as a representation of the skull by generative models for craniofacial reconstruction. We have evaluated the quality of generated faces using FID, IS, and SSIM scores. Finally, we have proposed a retrieval framework where the query is the generated face image and the gallery is the database of real faces. By experimental results, we have found that this can be an effective tool for forensic science.
Unified Anomaly Detection methods on Edge Device using Knowledge Distillation and Quantization
Jul 03, 2024


Abstract:With the rapid advances in deep learning and smart manufacturing in Industry 4.0, there is an imperative for high-throughput, high-performance, and fully integrated visual inspection systems. Most anomaly detection approaches using defect detection datasets, such as MVTec AD, employ one-class models that require fitting separate models for each class. On the contrary, unified models eliminate the need for fitting separate models for each class and significantly reduce cost and memory requirements. Thus, in this work, we experiment with considering a unified multi-class setup. Our experimental study shows that multi-class models perform at par with one-class models for the standard MVTec AD dataset. Hence, this indicates that there may not be a need to learn separate object/class-wise models when the object classes are significantly different from each other, as is the case of the dataset considered. Furthermore, we have deployed three different unified lightweight architectures on the CPU and an edge device (NVIDIA Jetson Xavier NX). We analyze the quantized multi-class anomaly detection models in terms of latency and memory requirements for deployment on the edge device while comparing quantization-aware training (QAT) and post-training quantization (PTQ) for performance at different precision widths. In addition, we explored two different methods of calibration required in post-training scenarios and show that one of them performs notably better, highlighting its importance for unsupervised tasks. Due to quantization, the performance drop in PTQ is further compensated by QAT, which yields at par performance with the original 32-bit Floating point in two of the models considered.
Nys-Curve: Nyström-Approximated Curvature for Stochastic Optimization
Oct 16, 2021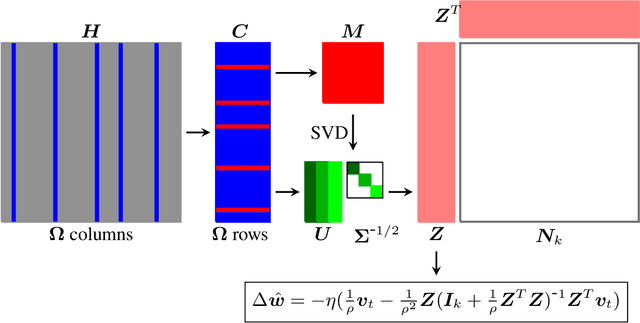

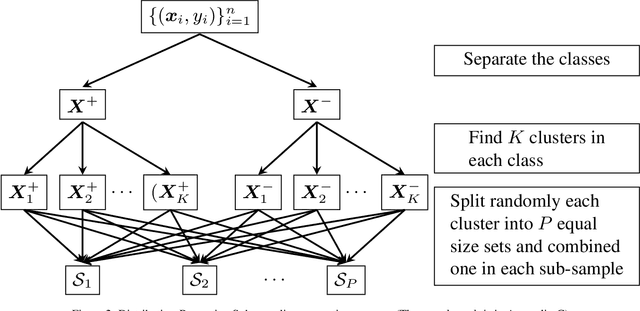
Abstract:The quasi-Newton methods generally provide curvature information by approximating the Hessian using the secant equation. However, the secant equation becomes insipid in approximating the Newton step owing to its use of the first-order derivatives. In this study, we propose an approximate Newton step-based stochastic optimization algorithm for large-scale empirical risk minimization of convex functions with linear convergence rates. Specifically, we compute a partial column Hessian of size ($d\times k$) with $k\ll d$ randomly selected variables, then use the \textit{Nystr\"om method} to better approximate the full Hessian matrix. To further reduce the computational complexity per iteration, we directly compute the update step ($\Delta\boldsymbol{w}$) without computing and storing the full Hessian or its inverse. Furthermore, to address large-scale scenarios in which even computing a partial Hessian may require significant time, we used distribution-preserving (DP) sub-sampling to compute a partial Hessian. The DP sub-sampling generates $p$ sub-samples with similar first and second-order distribution statistics and selects a single sub-sample at each epoch in a round-robin manner to compute the partial Hessian. We integrate our approximated Hessian with stochastic gradient descent and stochastic variance-reduced gradients to solve the logistic regression problem. The numerical experiments show that the proposed approach was able to obtain a better approximation of Newton\textquotesingle s method with performance competitive with the state-of-the-art first-order and the stochastic quasi-Newton methods.
FsNet: Feature Selection Network on High-dimensional Biological Data
Jan 23, 2020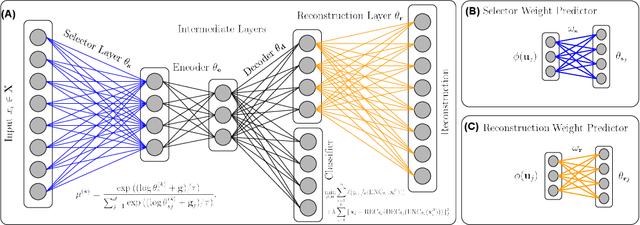
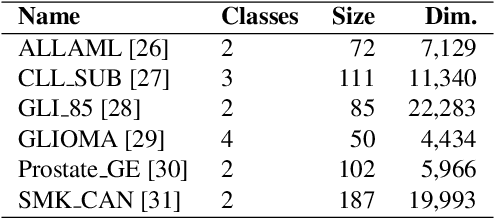
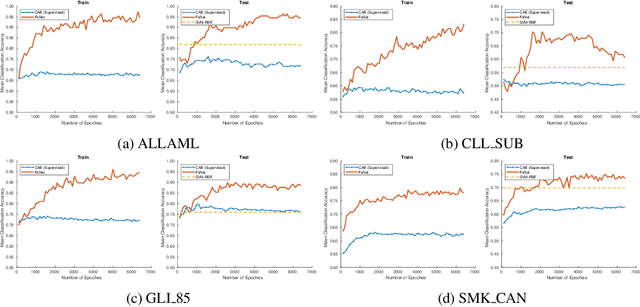
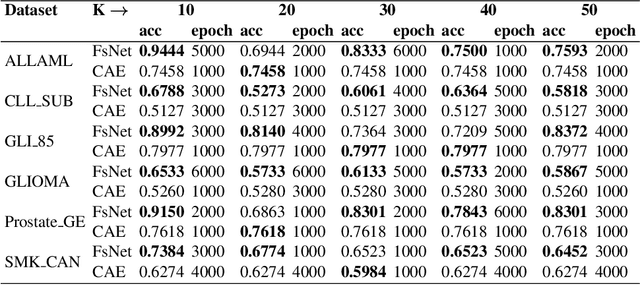
Abstract:Biological data are generally high-dimensional and require efficient machine learning methods that are well generalized and scalable to discover their complex nonlinear patterns. The recent advances in the domain of artificial intelligence and machine learning can be attributed to deep neural networks (DNNs) because they accomplish a variety of tasks in computer vision and natural language processing. However, standard DNNs are not suitable for handling high-dimensional data and data with small number of samples because they require a large pool of computing resources as well as plenty of samples to learn a large number of parameters. In particular, although interpretability is important for high-dimensional biological data such as gene expression data, a nonlinear feature selection algorithm for DNN models has not been fully investigated. In this paper, we propose a novel nonlinear feature selection method called the Feature Selection Network (FsNet), which is a scalable concrete neural network architecture, under high-dimensional and small number of samples setups. Specifically, our network consists of a selector layer that uses a concrete random variable for discrete feature selection and a supervised deep neural network regularized with the reconstruction loss. Because a large number of parameters in the selector and reconstruction layer can easily cause overfitting under a limited number of samples, we use two tiny networks to predict the large virtual weight matrices of the selector and reconstruction layers. The experimental results on several real-world high-dimensional biological datasets demonstrate the efficacy of the proposed approach.
GraphLIME: Local Interpretable Model Explanations for Graph Neural Networks
Jan 17, 2020
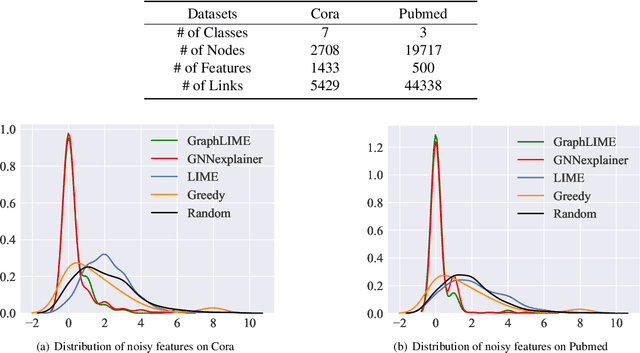
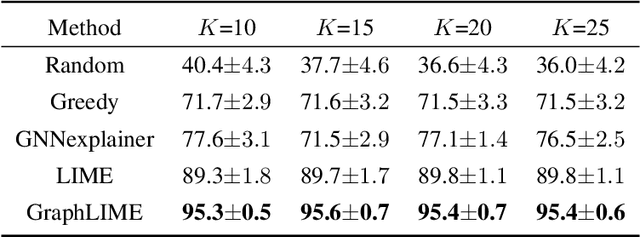
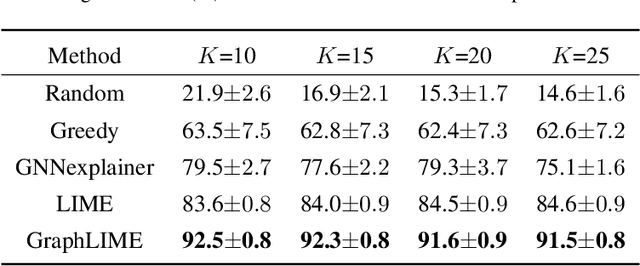
Abstract:Graph structured data has wide applicability in various domains such as physics, chemistry, biology, computer vision, and social networks, to name a few. Recently, graph neural networks (GNN) were shown to be successful in effectively representing graph structured data because of their good performance and generalization ability. GNN is a deep learning based method that learns a node representation by combining specific nodes and the structural/topological information of a graph. However, like other deep models, explaining the effectiveness of GNN models is a challenging task because of the complex nonlinear transformations made over the iterations. In this paper, we propose GraphLIME, a local interpretable model explanation for graphs using the Hilbert-Schmidt Independence Criterion (HSIC) Lasso, which is a nonlinear feature selection method. GraphLIME is a generic GNN-model explanation framework that learns a nonlinear interpretable model locally in the subgraph of the node being explained. More specifically, to explain a node, we generate a nonlinear interpretable model from its $N$-hop neighborhood and then compute the K most representative features as the explanations of its prediction using HSIC Lasso. Through experiments on two real-world datasets, the explanations of GraphLIME are found to be of extraordinary degree and more descriptive in comparison to the existing explanation methods.
 Add to Chrome
 Add to Firefox
 Add to Edge