David S. Ebert
Analyzing Worldwide Social Distancing through Large-Scale Computer Vision
Aug 27, 2020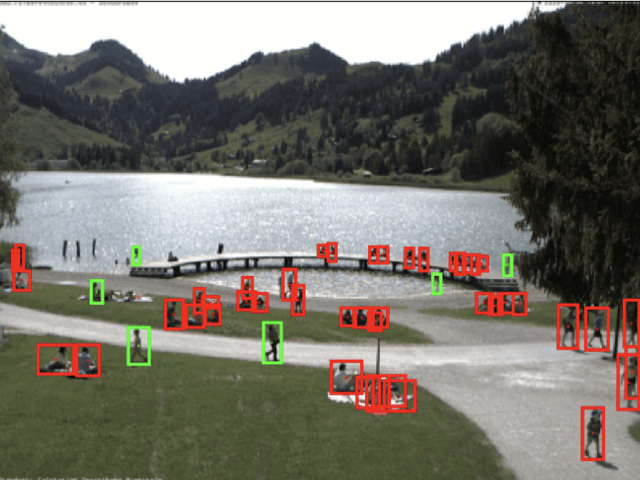

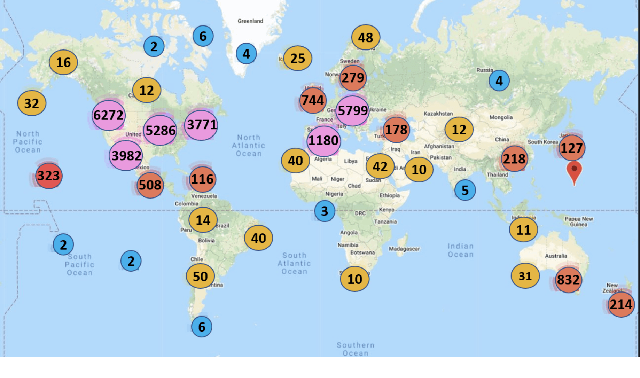
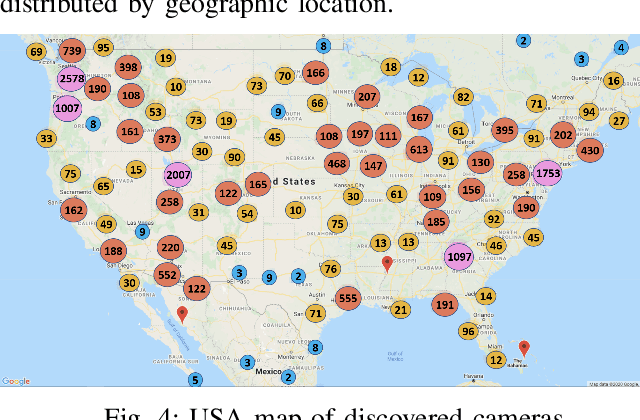
Abstract:In order to contain the COVID-19 pandemic, countries around the world have introduced social distancing guidelines as public health interventions to reduce the spread of the disease. However, monitoring the efficacy of these guidelines at a large scale (nationwide or worldwide) is difficult. To make matters worse, traditional observational methods such as in-person reporting is dangerous because observers may risk infection. A better solution is to observe activities through network cameras; this approach is scalable and observers can stay in safe locations. This research team has created methods that can discover thousands of network cameras worldwide, retrieve data from the cameras, analyze the data, and report the sizes of crowds as different countries issued and lifted restrictions (also called ''lockdown''). We discover 11,140 network cameras that provide real-time data and we present the results across 15 countries. We collect data from these cameras beginning April 2020 at approximately 0.5TB per week. After analyzing 10,424,459 images from still image cameras and frames extracted periodically from video, the data reveals that the residents in some countries exhibited more activity (judged by numbers of people and vehicles) after the restrictions were lifted. In other countries, the amounts of activities showed no obvious changes during the restrictions and after the restrictions were lifted. The data further reveals whether people stay ''social distancing'', at least 6 feet apart. This study discerns whether social distancing is being followed in several types of locations and geographical locations worldwide and serve as an early indicator whether another wave of infections is likely to occur soon.
Geovisual Analytics and Interactive Machine Learning for Situational Awareness
Oct 11, 2019

Abstract:The first responder community has traditionally relied on calls from the public, officially-provided geographic information and maps for coordinating actions on the ground. The ubiquity of social media platforms created an opportunity for near real-time sensing of the situation (e.g. unfolding weather events or crises) through volunteered geographic information. In this article, we provide an overview of the design process and features of the Social Media Analytics Reporting Toolkit (SMART), a visual analytics platform developed at Purdue University for providing first responders with real-time situational awareness. We attribute its successful adoption by many first responders to its user-centered design, interactive (geo)visualizations and interactive machine learning, giving users control over analysis.
City-level Geolocation of Tweets for Real-time Visual Analytics
Oct 05, 2019


Abstract:Real-time tweets can provide useful information on evolving events and situations. Geotagged tweets are especially useful, as they indicate the location of origin and provide geographic context. However, only a small portion of tweets are geotagged, limiting their use for situational awareness. In this paper, we adapt, improve, and evaluate a state-of-the-art deep learning model for city-level geolocation prediction, and integrate it with a visual analytics system tailored for real-time situational awareness. We provide computational evaluations to demonstrate the superiority and utility of our geolocation prediction model within an interactive system.
Interactive Learning for Identifying Relevant Tweets to Support Real-time Situational Awareness
Aug 01, 2019


Abstract:Various domain users are increasingly leveraging real-time social media data to gain rapid situational awareness. However, due to the high noise in the deluge of data, effectively determining semantically relevant information can be difficult, further complicated by the changing definition of relevancy by each end user for different events. The majority of existing methods for short text relevance classification fail to incorporate users' knowledge into the classification process. Existing methods that incorporate interactive user feedback focus on historical datasets. Therefore, classifiers cannot be interactively retrained for specific events or user-dependent needs in real-time. This limits real-time situational awareness, as streaming data that is incorrectly classified cannot be corrected immediately, permitting the possibility for important incoming data to be incorrectly classified as well. We present a novel interactive learning framework to improve the classification process in which the user iteratively corrects the relevancy of tweets in real-time to train the classification model on-the-fly for immediate predictive improvements. We computationally evaluate our classification model adapted to learn at interactive rates. Our results show that our approach outperforms state-of-the-art machine learning models. In addition, we integrate our framework with the extended Social Media Analytics and Reporting Toolkit (SMART) 2.0 system, allowing the use of our interactive learning framework within a visual analytics system tailored for real-time situational awareness. To demonstrate our framework's effectiveness, we provide domain expert feedback from first responders who used the extended SMART 2.0 system.
Manifold: A Model-Agnostic Framework for Interpretation and Diagnosis of Machine Learning Models
Aug 01, 2018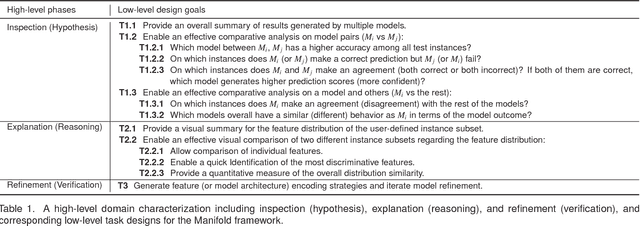

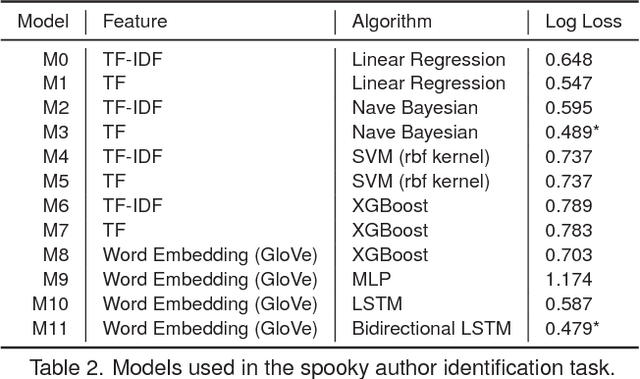

Abstract:Interpretation and diagnosis of machine learning models have gained renewed interest in recent years with breakthroughs in new approaches. We present Manifold, a framework that utilizes visual analysis techniques to support interpretation, debugging, and comparison of machine learning models in a more transparent and interactive manner. Conventional techniques usually focus on visualizing the internal logic of a specific model type (i.e., deep neural networks), lacking the ability to extend to a more complex scenario where different model types are integrated. To this end, Manifold is designed as a generic framework that does not rely on or access the internal logic of the model and solely observes the input (i.e., instances or features) and the output (i.e., the predicted result and probability distribution). We describe the workflow of Manifold as an iterative process consisting of three major phases that are commonly involved in the model development and diagnosis process: inspection (hypothesis), explanation (reasoning), and refinement (verification). The visual components supporting these tasks include a scatterplot-based visual summary that overviews the models' outcome and a customizable tabular view that reveals feature discrimination. We demonstrate current applications of the framework on the classification and regression tasks and discuss other potential machine learning use scenarios where Manifold can be applied.
 Add to Chrome
 Add to Firefox
 Add to Edge